How to Get Delivery Reporting & How Invoicing Works
Last updated: May 29, 2026
Track your campaign’s progress!
Delivery reporting is an efficient way to check how many downloads a podcaster’s ad read is getting in real-time as well as over the span of the campaign. Agencies needing reporting should first log in to the RedCircle Ad Platform (RAP). (See this Help article if you need help logging in.)
There are a couple of ways to view delivery reporting on RedCircle: on the campaign page itself and the Reporting tab.
Campaign Page
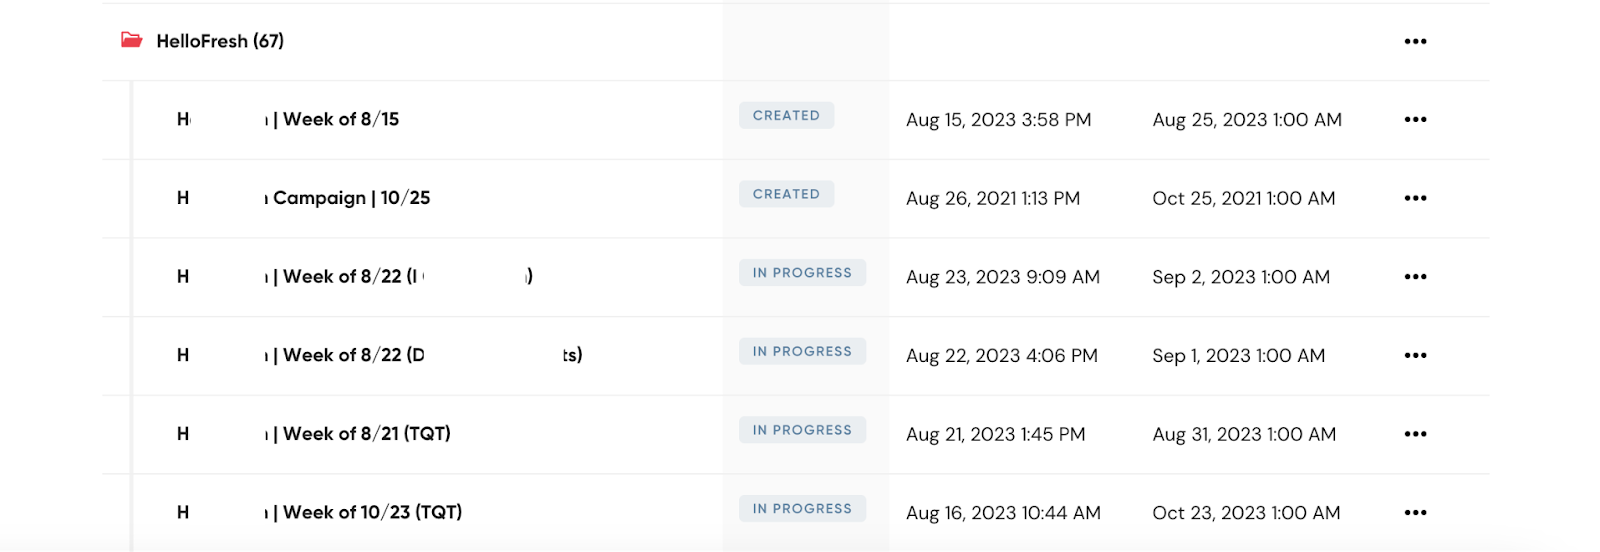
Find or search for the campaign you want to track and select its name. The campaigns on the platform are separated by the start date of each flight and labeled as “Brand Name | Week of Start Date (Show Abbreviation if necessary)”:
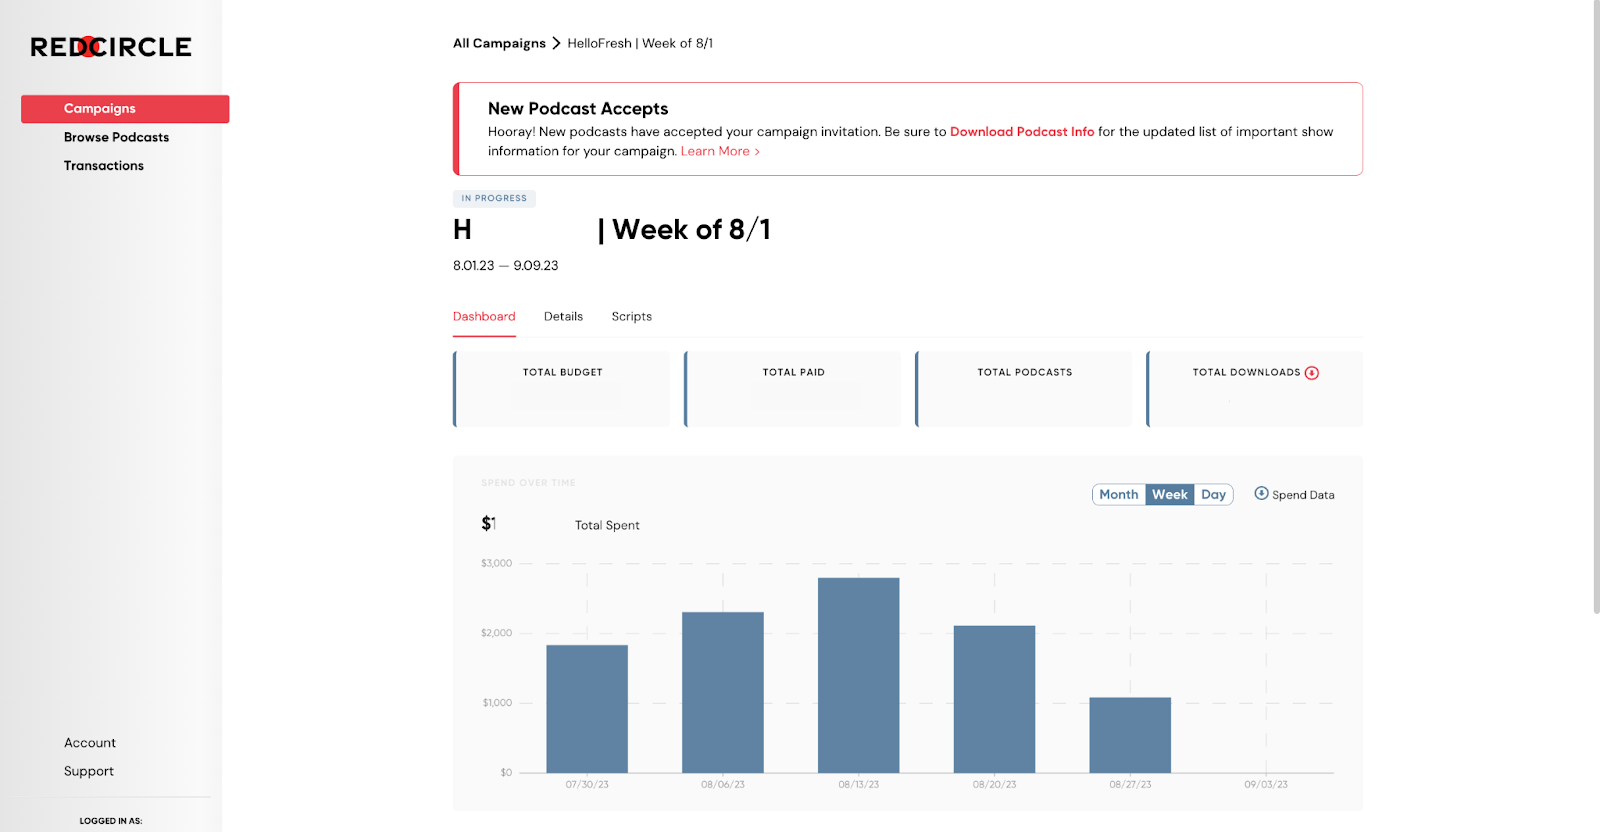
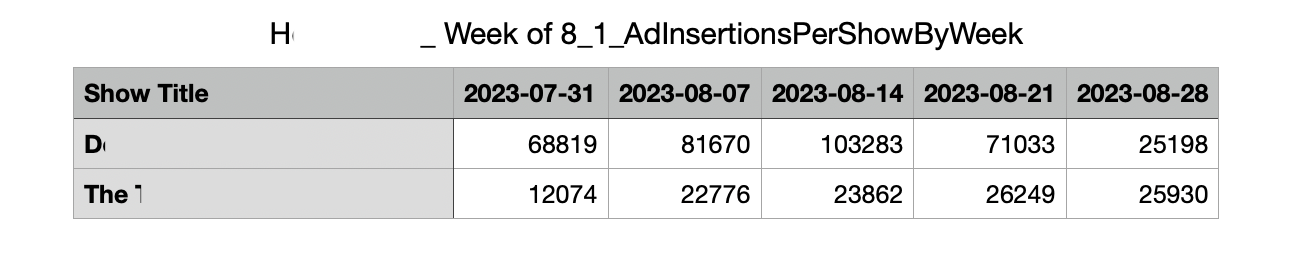
There should be a red download button right below the Dashboards tab and beside the Total Downloads figure. Clicking the red download button produces a report of ad insertions per show by week:
From here, the agency can review the number of weekly ad insertions each show is getting throughout the timeline of the flight. These also can be tallied up to determine how close each campaign is to reaching its goal.
Report on Spend and Impressions in Aggregate for Campaign
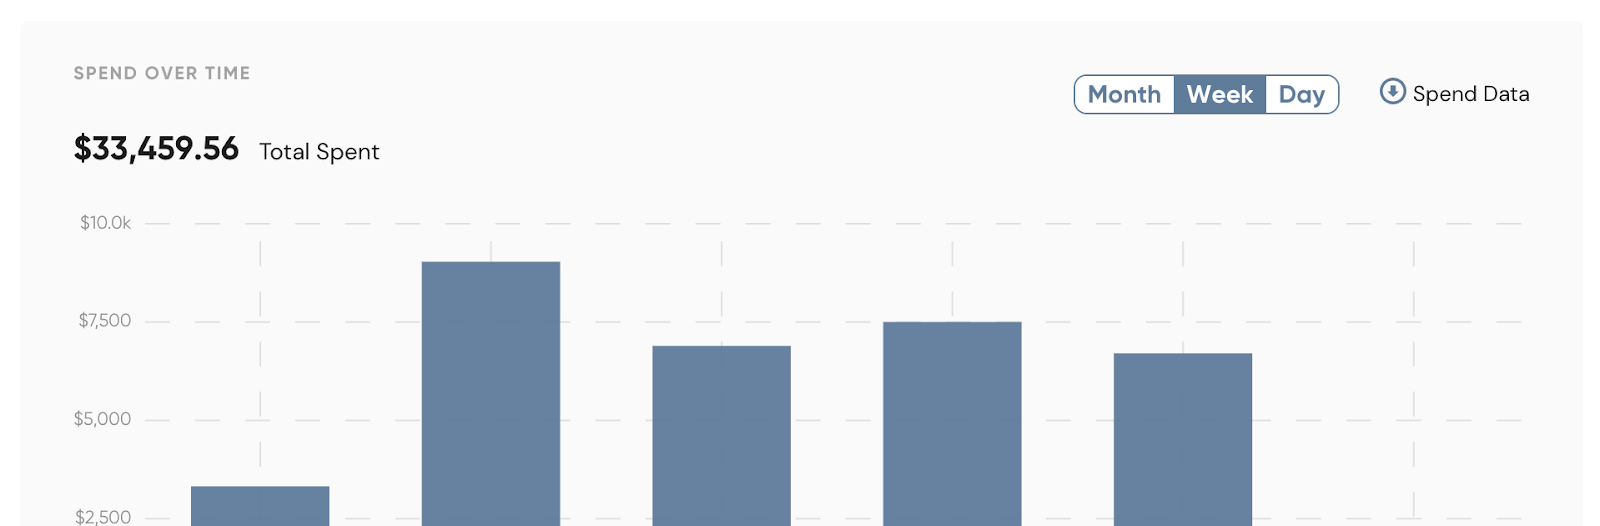
To see impressions and spend aggregated across all shows in a campaign, click the “Spend Data” button on the right side of the Spend Over Time chart. Toggling the chart to monthly, weekly, or daily before clicking that button changes the resulting report to daily, weekly, and monthly.
Repeat this process as necessary. If you come across any issues, please reach out to our Ad Ops team at ad-ops@getredcircle.com or through our contact form.
Reporting Page
This page allows you to view insertions and spend data for multiple campaigns, varying podcasts, time ranges, and more.
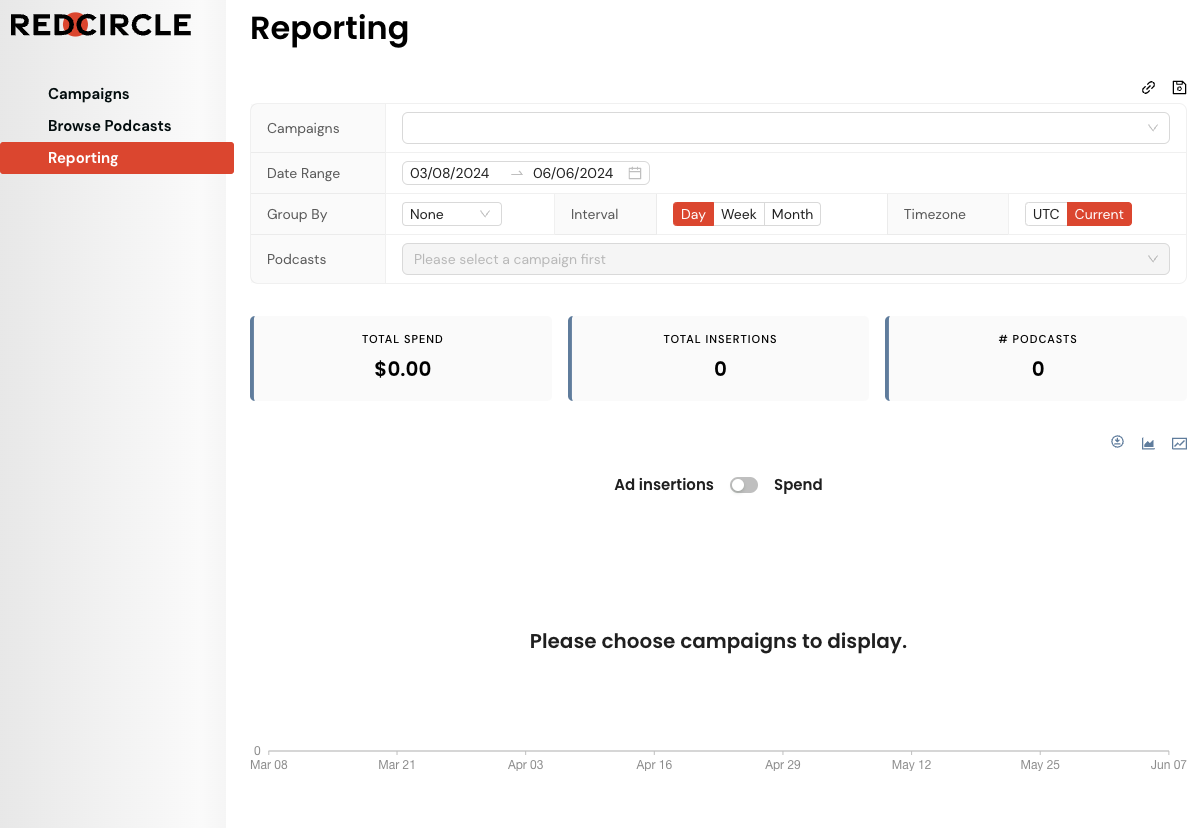
To start, you can filter data by campaigns. Simply click on the Campaigns text field and select which campaigns you’d like to view:
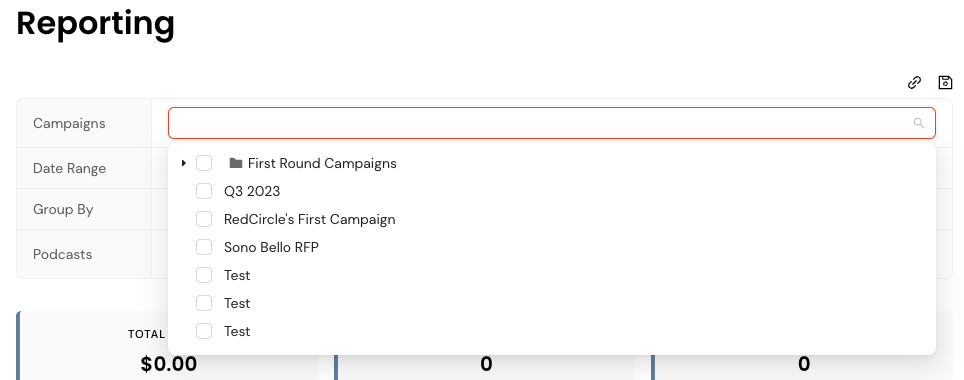
You can select one or more campaigns in this drop-down menu.
Next, you can decide what date range you want to view the data for:
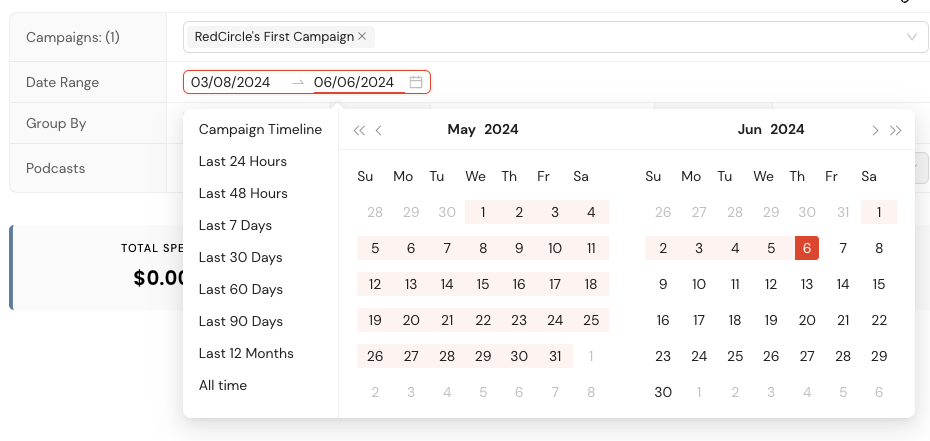
You can choose from our presets on the left side of the widget, or create your own custom by marking the dates on the calendar.
You can also group data by campaign or podcast:
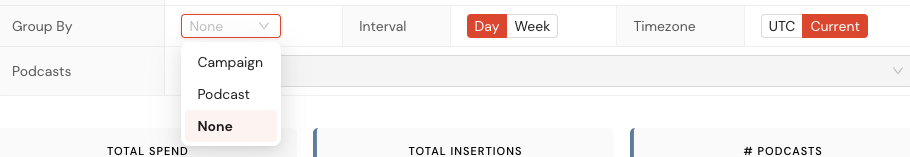
You can decide the intervals to be either daily or weekly, and choose the timezone format between UTC and your current timezone.
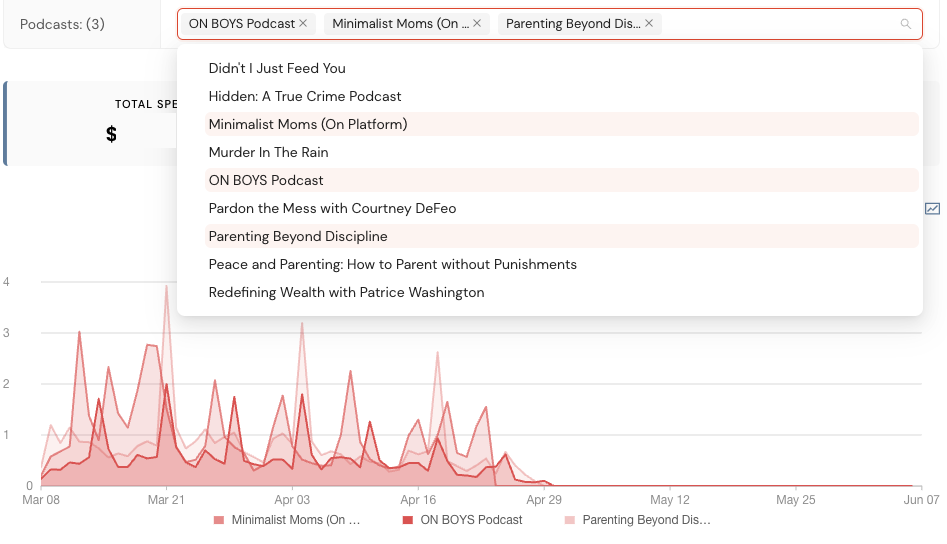
Finally, you can view specific podcasts in the selected campaign(s):
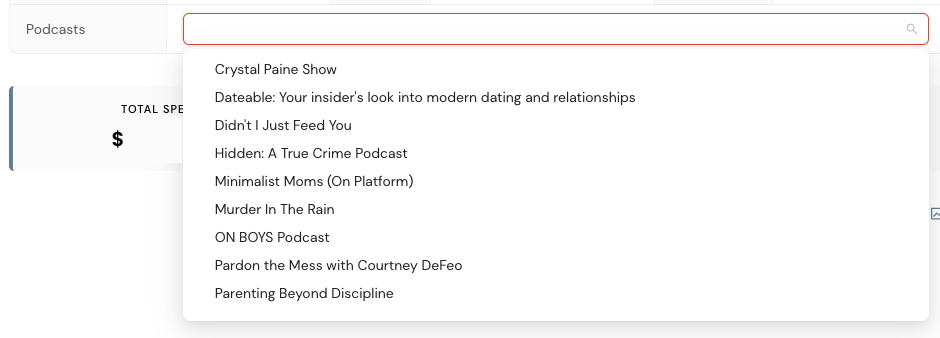
Once you select a podcast (or two or three!) you can view and even compare their performance:
There are a couple of features that allow you to view the chart in a different way such as viewing Spend or Ad Insertions:

And whether or not you want the chart to be stacked:
And you can even download all of these reports to save for your own records!

Please note that these reported impression numbers match very closely, but may not match exactly, to the impression numbers on your final billing for the campaign. This small difference is caused by the time zone in which you download your reporting. The impression numbers included on your billing should be considered the final definitive numbers.
Invoicing
We use delivery reporting to accurately invoice.
Campaigns are typically billed for on a calendar monthly basis unless otherwise specified on your signed IO.
Invoices are collected based on numbers pulled from the reporting page. It is important to note that we pull invoices from the UTC time zone. If you want the reporting you pull to exactly match our invoicing, make sure the time zone is "UTC."
To pull your own reporting make sure to follow the steps listed above under the Reporting Page section and that you have properly selected the date range based on your invoicing settings. For calendar monthly reporting, you would select the first of the month through the end of the month. When you download the report, you will see the total spend for each campaign and podcast you choose which will correlate to the invoice you receive from us!
Please reach out to payments@getredcircle.com with any questions or discrepancies about invoicing.