Exploring the Downloads Page
Last updated: May 29, 2026
Everything You Need to Know About Your Downloads
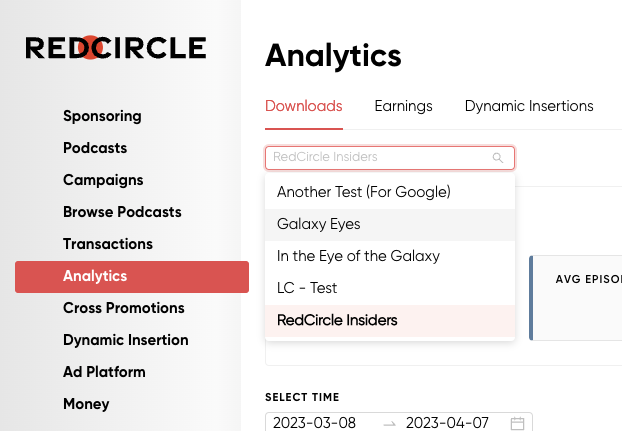
RedCircle provides some of the most powerful analytic tools in podcasting. The analytics page is split into 3 different sections: Downloads, Earnings, and Dynamic Insertions. Depending on your plan, you can view some or all of the available data sets.
Let’s take a deeper look at what the Downloads page has to offer!
Downloads Page Overview
The Downloads page displays plenty of information regarding the downloads (or ‘streams’) for your show. RedCircle strictly adheres to the IAB podcast measurement standards which is the agreed-upon industry system for measuring podcast listening.
The page is broken down into various sections, including:
- Downloads Overview: Displays quick stats such as Total Downloads, Average Episode Downloads, Average Weekly Downloads, and Exclusive Subscribers.
- Downloads: This graph displays downloads accumulated either over time or the cumulative total (the total sum) since first published.
- Episode Performance: This line graph shows the performance of your Top 5 most popular episodes. All other episodes, and their performance, is shown in the table below the chart.
- Listening App/Device/OS: Each of these widgets show the number of downloads per app, device, and OS.
- Podcast Performance: This line graph shows the total number of downloads for your podcast(s) for each day. This particular chart is helpful for those who have multiple shows on their account.
- Download Time of Day: This heatmap chart shows at what time of day listeners tune in to your podcast. It helps to determine when the best time to drop a new episode might be.
- Geolocation Performance: This table shows which geographic region your listeners are tuning in from. You can change the filter from Country to City, Region, or Continent.
- Exclusive Downloads: This graph displays the number of downloads for your exclusive episodes.
- Quick Access To Other Analytics Dashboards: These are links to the analytics dashboards of the major listening platforms.
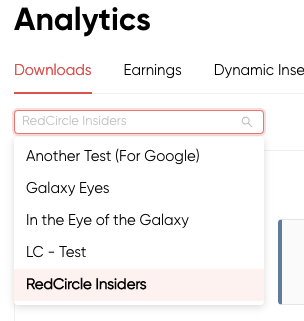
Each of these sections (sans the Overview) displays information based on two default filters. The first filter is the Show Filter, which defaults to the first podcast alphabetically if you have multiple shows. If you have one show, then it defaults to that show!
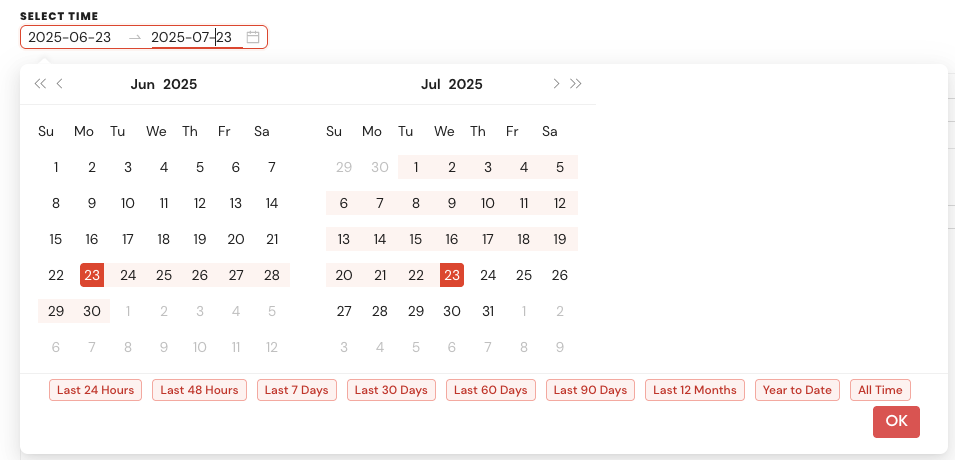
The second filter is the Time and Date Range Filter, which displays data based on the selected time/date range. This filter defaults to the past 30 days, but you’re able to select from a wide variety of preset date ranges or select specific dates.
Now that we covered the basics of the Downloads page, let’s jump into what this page looks like for each plan!
Core Plan Access
The Core plan, also known as the Free plan, provides a limited view of the Downloads page. Those on the Core plan are able to view the following widgets:
- Downloads Overview
- Downloads Graph
- Episode Performance Graph & Table
- Listening App/Device/OS Graphs
- Quick Access To Other Analytics Dashboards
Let’s take a closer look at each of these widgets!
Downloads Overview
The Downloads Overview widget gives you a quick view of the most important data for your show(s).
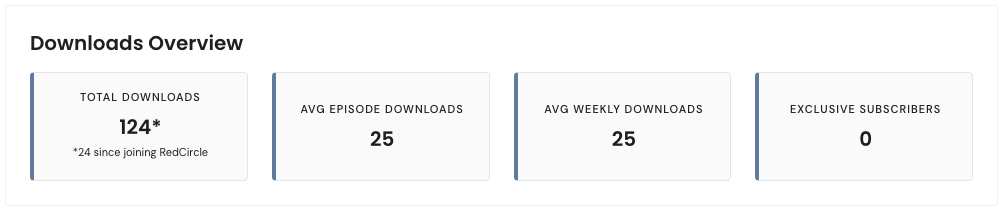
- Total Downloads accounts for all downloads accumulated for the selected time frame.
- Avg Episode Downloads shows the average number of downloads for your episodes.
- Avg Weekly Downloads shows the average number of downloads accumulated in one week.
- Exclusive Subscribers shows the number of listeners subscribed to your Exclusive Content (if applicable.)
The Downloads Overview widget only changes based on the Show Filter.
Downloads Graph
Not to be confused with the Downloads Overview section, the Downloads graph displays the number of downloads accumulated over the selected time frame.
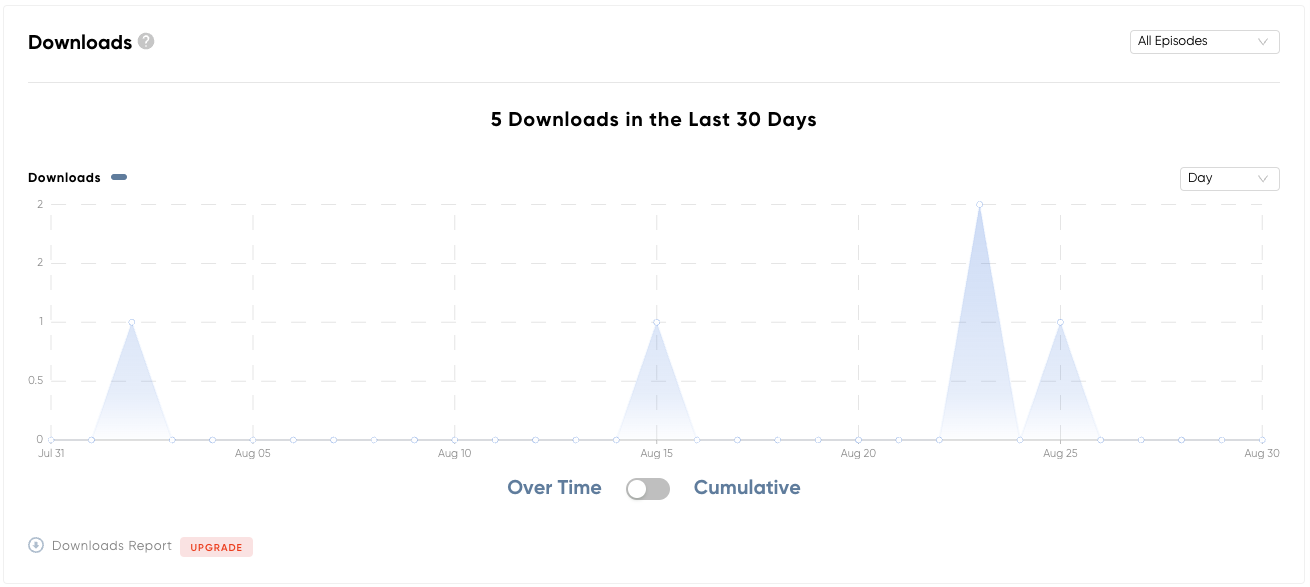
There are a few additional filters for the Downloads graph, including Episodes, Date Range, and Over Time vs. Cumulative.
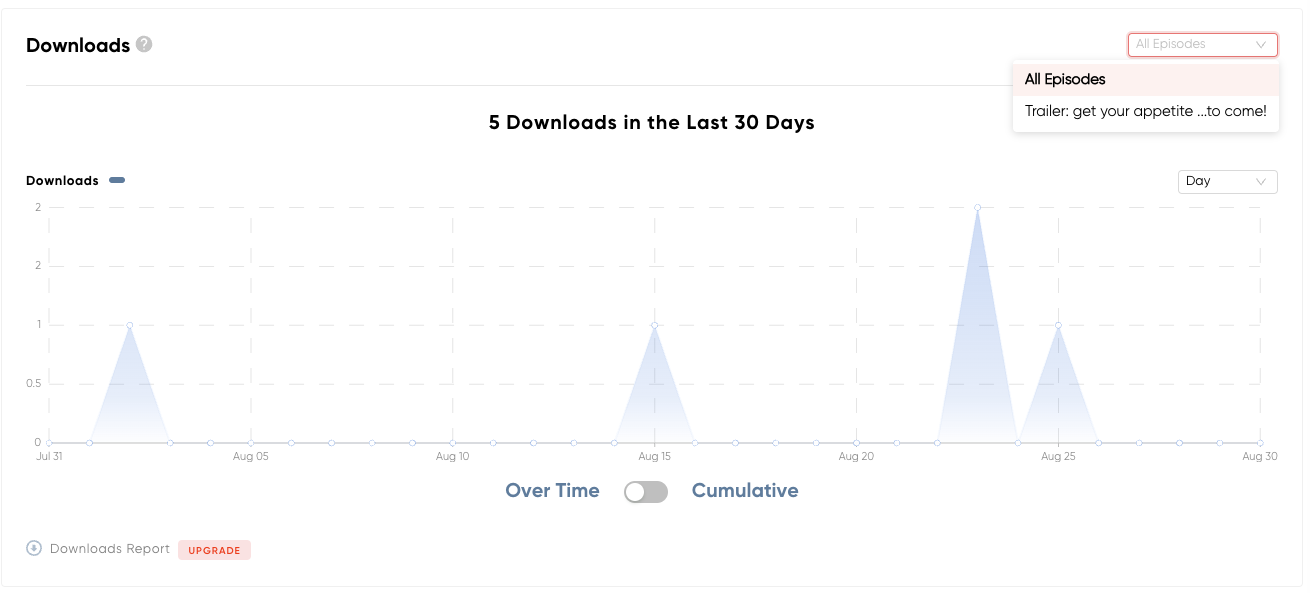
The Episode filter allows you to select all episodes of your podcast, or a specific episode:
The Date Range filter allows you to display data either by “Day” or by “Week”:
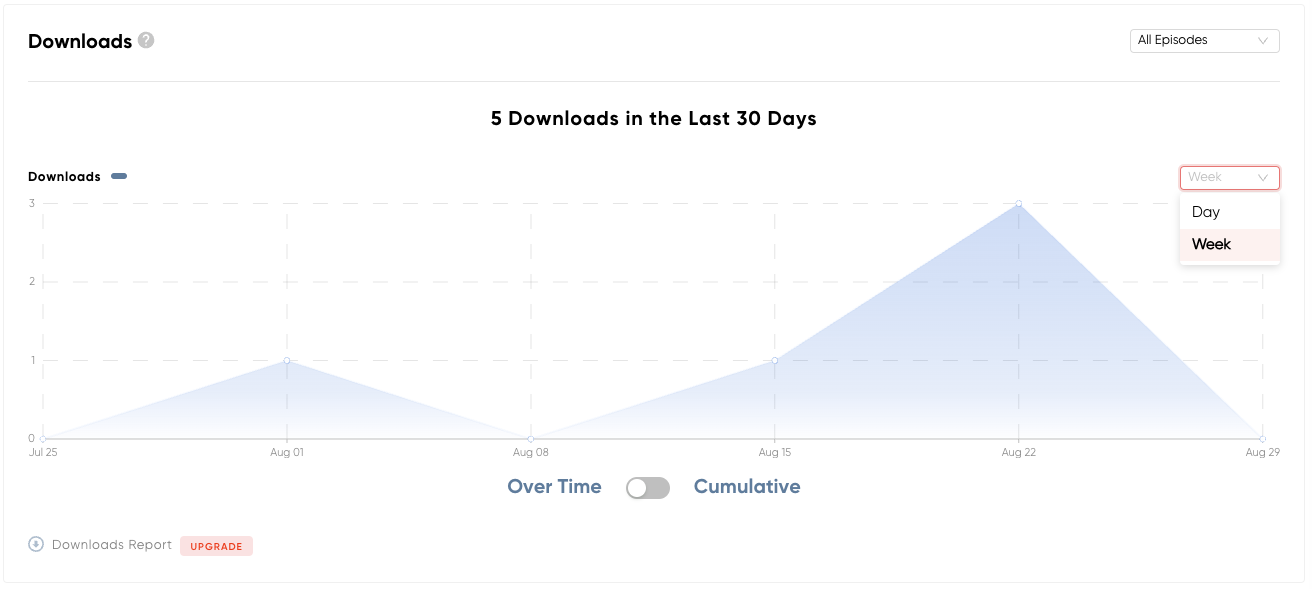
You can see that selecting Week changes the graph. The downloads are being displayed on a weekly interval rather than a daily one.
The Over Time vs. Cumulative toggle shows downloads either “over time”, meaning the number of downloads is shown for each date specified in the Time and Date Range Filter, or “cumulatively”, meaning the number of downloads displayed build on each other.
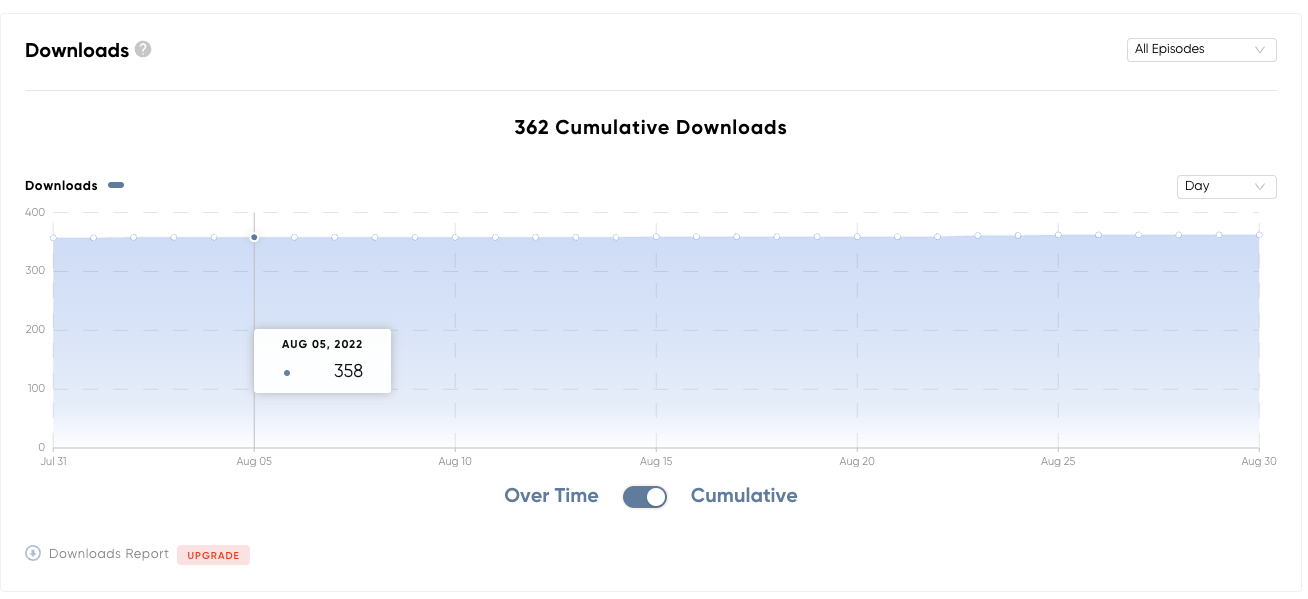
You can see from the above chart that Cumulative creates a sort of ‘block’ graph. This is because it’s showing the total number of downloads collected across the specified date range for each date in time. So, by Aug 05, this podcast totaled 358 downloads, but by Aug 15 this podcast received one (1) new download, thus the cumulative total increased to 359 downloads:
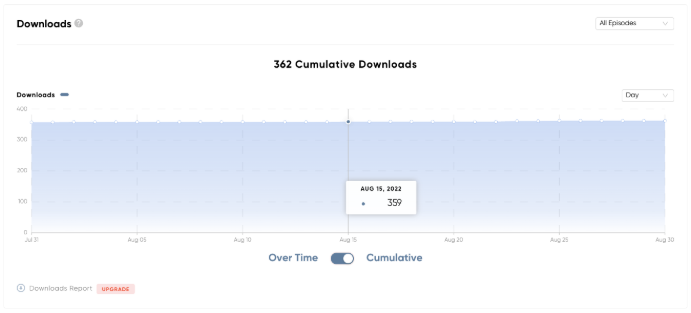
As you can see, the downloads are building upon one another in this style of chart.
Episode Performance Graph & Table
The Episode Performance Chart and Table further break down the downloads and show what each individual podcast episode received. The chart includes a couple of filters that can change the data displayed in both the chart and the accompanying table.
The Date Range filter allows you to select between the specified Date Range, set by the Time and Date Range filter at the very top of the Downloads page, and the date the episode was first published. (Please note: The “Since Published” option is only available for those on the Growth plan or higher.)
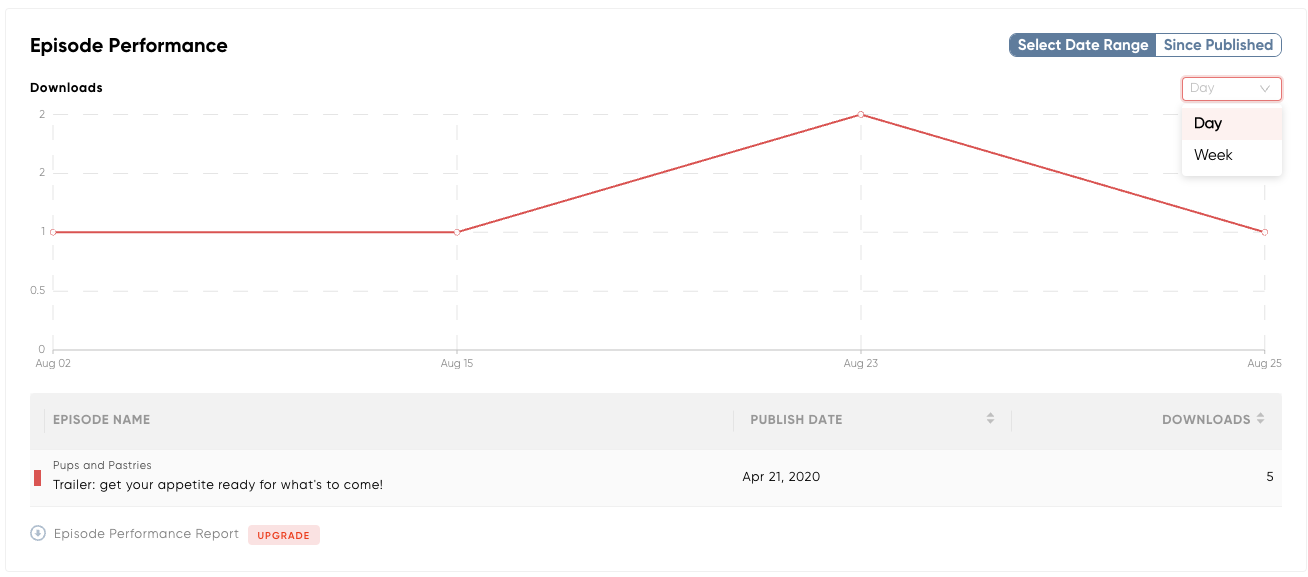
From the example above, you can also see that you can change the filter from Day to Week, which functions similarly to the Day/Week filter for the Downloads graph.
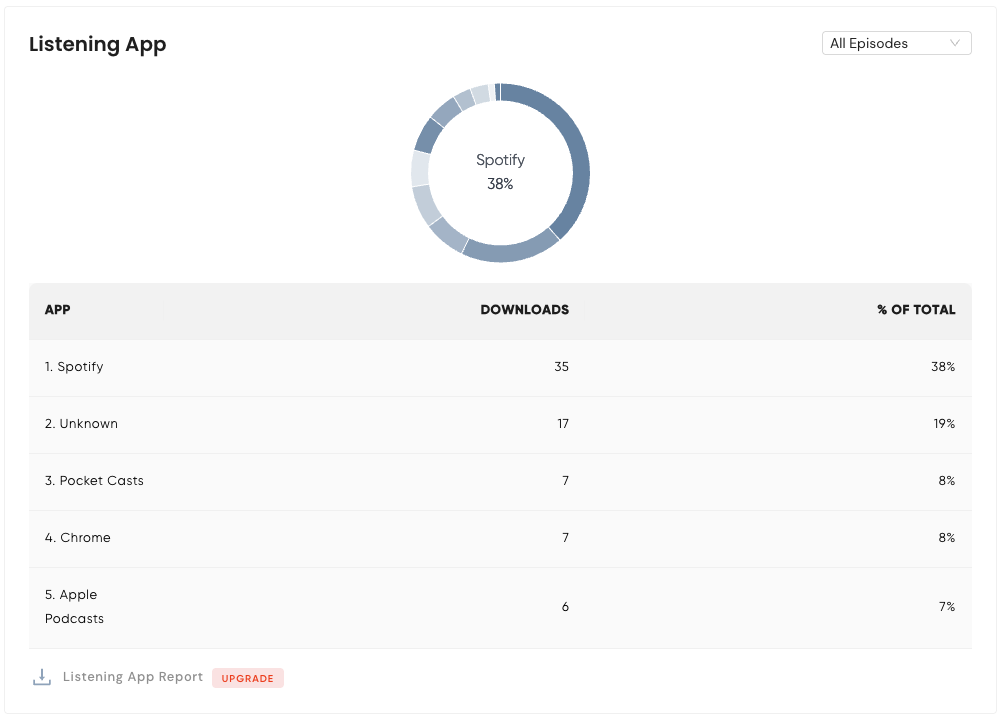
Listening App/Device/OS Graphs
This set of graphs display where your downloads are coming from. The Listening App graph shows which apps your listeners are using to tune in to your show(s):
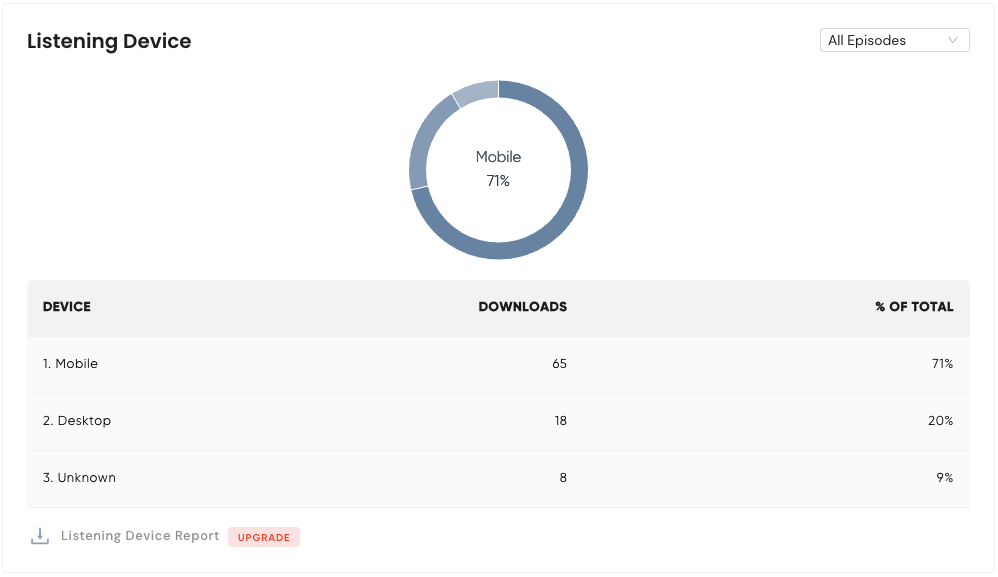
The Listening Device graph displays what type of devices your listeners are using to tune in to your show(s):
And the Listening OS graph displays which Operating Systems (OS) your listeners are using:
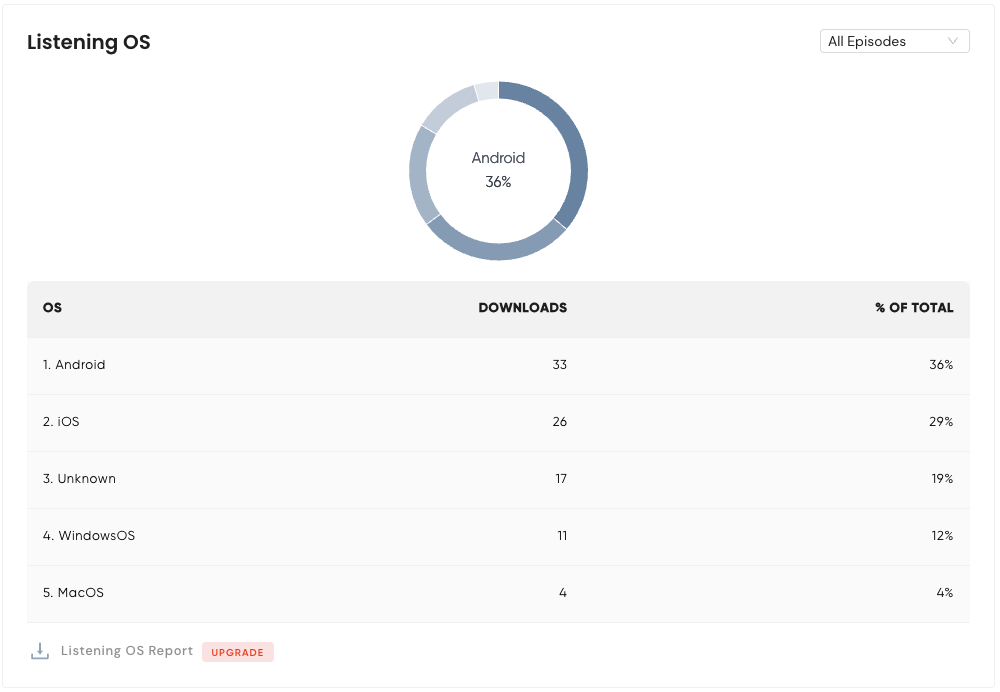
You might notice that each of these graphs has the same Episodes filter in the top-right corner. This filter allows you to select a specific episode or all episodes of your show.
Quick Access To Other Analytics Dashboards
This widget just provides you with easy-access links to the major listening platforms’ analytic dashboards:
Growth Plan Access
The Growth Plan provides an elevated view compared to the Core plan. Though, there are some features that remain locked.
Those on the Growth plan are able to view the following widgets:
- Downloads Overview
- Downloads Graph
- Episode Performance Graph & Table
- Listening App/Device/OS Graphs
- Download Time of Day Graph
- Geolocation Performance Table & Graph
- Exclusive Downloads Graph
- Quick Access To Other Analytics Dashboards
Let’s take a closer look at each of these widgets!
Downloads Overview
The Downloads Overview widget gives you a quick view of the most important data for your show(s). This particular widget does not change based on plan. See Core Plan Access for information.
Downloads Graph
Not to be confused with the Downloads Overview section, the Downloads graph displays the number of downloads accumulated over the selected time frame. Similar to the above, this widget remains almost entirely the same no matter which plan you have. See Core Plan Access for information.
The only change to be aware of is the ability to download the report/graph. All members on any paid plan can download reports. If you have multiple shows, then the Podcast Filter defaults to the first podcast in alphabetical order.
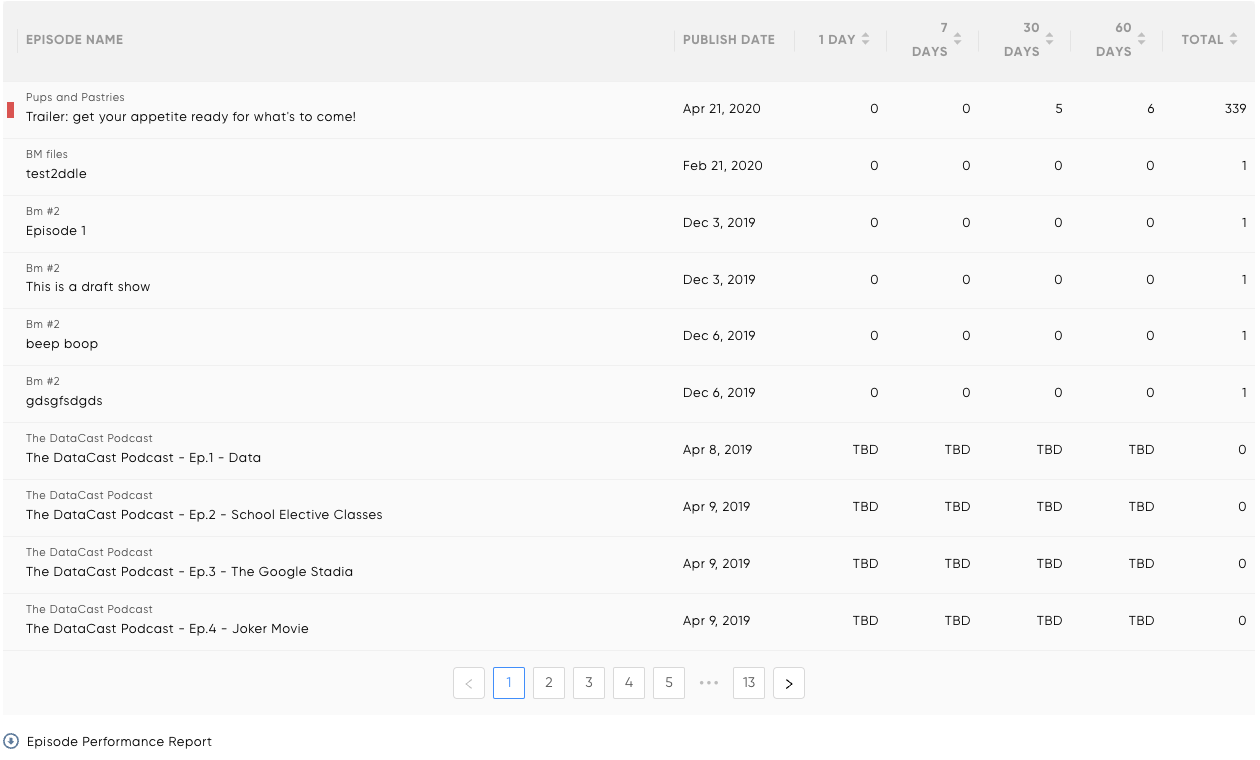
Episode Performance Graph & Table
The Episode Performance Chart and Table further break down the downloads and show what each individual podcast episode received. The chart includes a couple of filters that can change the data displayed in both the chart and accompanying table.
The Date Range filter allows you to select between the specified Date Range, set by the Time and Date Range filter at the very top of the Downloads page, and the date the episode was first published. See Core Plan Access for information on this graph and table.
The key difference between the Core plan and the paid plans, at least when it comes to this particular data set, is the ability to view episode performance since it was published.
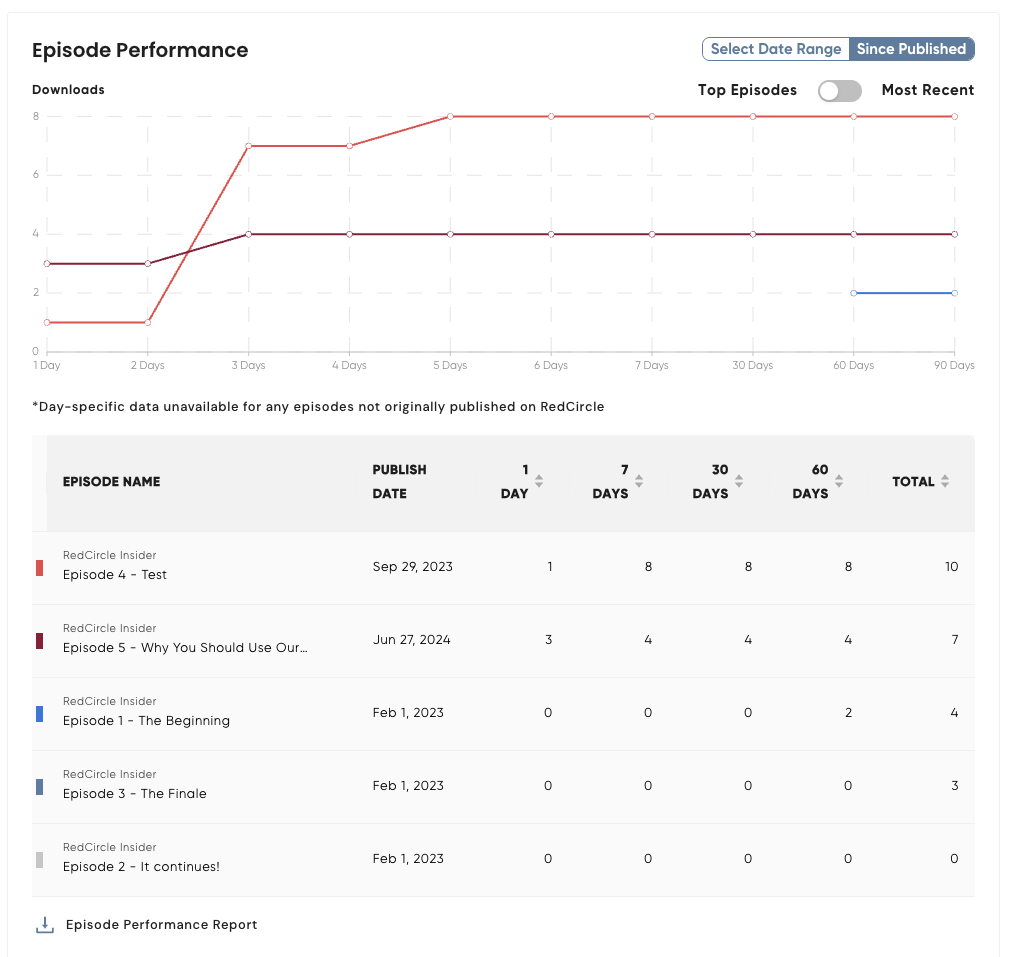
From the example above, you can see that the table below the graph, in particular, changes when Since Published is selected. You can view how an episode performs on the very first day it was published, to the first 7 days, to the first 30 days, and the first 60 days. These numbers won’t fluctuate since they are calculating the first X number of days.
When viewing the Episode Performance data with Since Published toggled on, you're viewing the exact 7 days (168 hours) since the episode was published. This takes into account the exact time the episode was published.
When you toggle Select Date Range and change the time frame, it encompasses all 24 hours for each selected date.
Please also note that the columns might show TBD. This is because not enough time has passed for the table to show an accurate count. So, if you posted an episode on January 1st at 10 a.m., then you’ll see a TBD in each column until the number of days listed has passed. For example, the “1 Day” column changes from TBD to 100 (or whatever number of downloads you receive in the first 24 hours since published) on January 2nd at 10 a.m.
You may also have noticed the Top Episodes vs. Most Recent episodes toggle underneath the Select Date Range/Since Published buttons. Top Episodes are the 5 episodes with the highest amount of downloads while the Most Recent episodes are the 5 most recent episodes published. The graph and table defaults to Top Episodes. If you have 5 or more episodes, then the 5 Top Episodes, or Most Recent, will have colors assigned to them so you can visualize their download count on the graph.
Another small difference between the Core and paid plans is the ability to download this report.
Listening App/Device/OS Graphs
This set of graphs display where your downloads are coming from. The Listening App graph shows which apps your listeners are using to tune in to your show(s).
The only difference between the Core plan and paid plans, in regards to these widgets, is the ability to download a report for each data set.
Download Time Of Day Graph
This graph is a heatmap showing you the time of day your listeners tend to tune in to your show. The darker the color, the more listeners are listening to your podcast at that time:
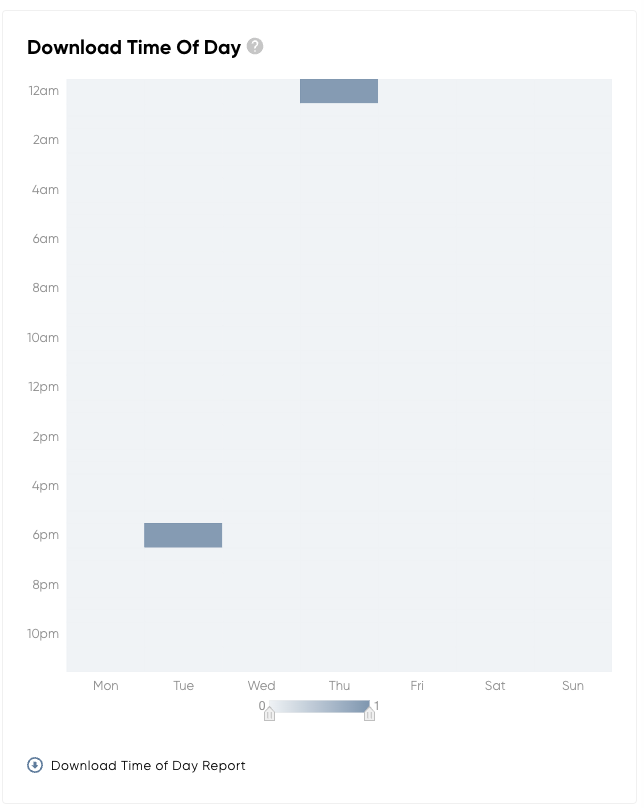
As you can see from the example above, most people are tuning in to this podcast at either 6 p.m. or 12 a.m. All time metrics are based on your device’s current time zone. So, if your computer is set to PST (Pacific Time) then all time-based metrics will adhere to that time zone.
Like every other widget on the Downloads page, you’re able to download this one if you’d like.
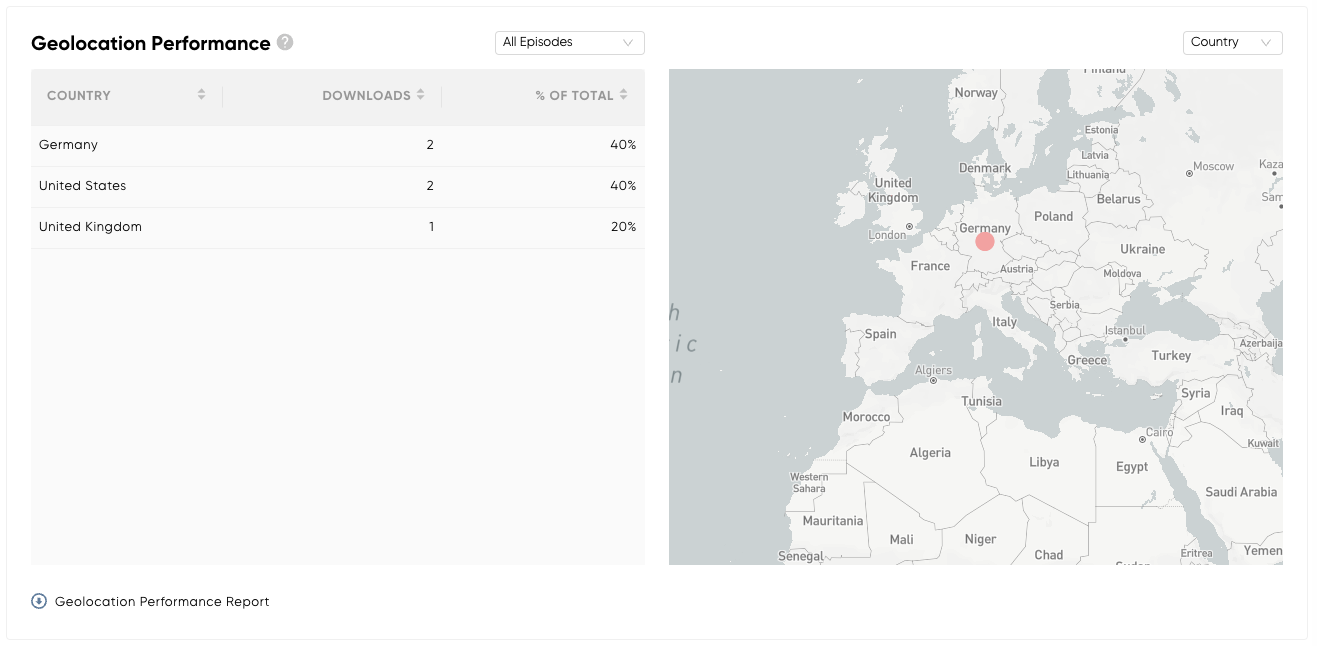
Geolocation Performance Graph & Table
This graph and table combo provides information on where your listeners are tuning in from. There are a couple of filters that change the graph and table depending on the selection. Like the other graphs, you can narrow the data set down to a specific episode or keep it set to all episodes:
The second filter allows you to change the size of location. For members on the Growth Plan specifically, you can choose from Country or City:
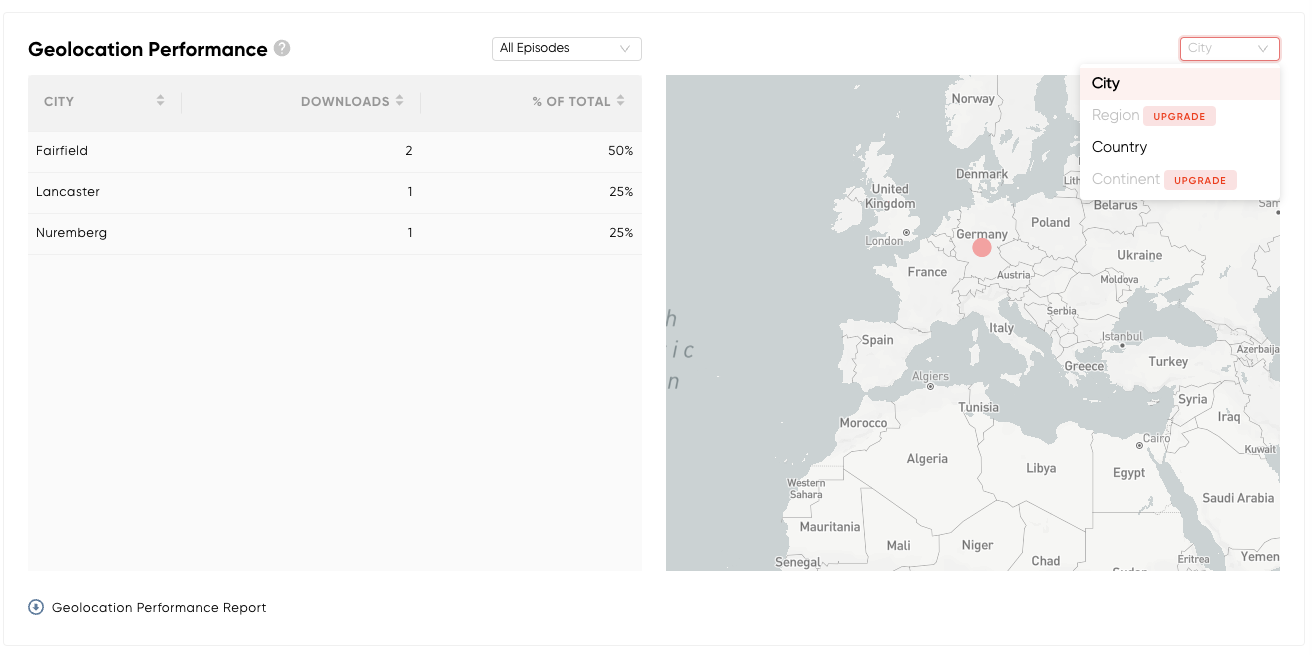
The table changes based on the location-type filter. This widget defaults to Country, but you can also select City, Region, and Continent based on your plan.
You might also notice the red circles on the interactive map. Those are where the highest concentration of your listeners live. Feel free to move the map around by clicking, and holding the click, then dragging your mouse around to move the map.
Like every other widget on the Downloads page, you’re able to download this one if you’d like.
Exclusive Downloads Graph
This graph displays the number of downloads for your episodes marked as exclusive. It’s a great way to see how well those specific types of episodes are performing.
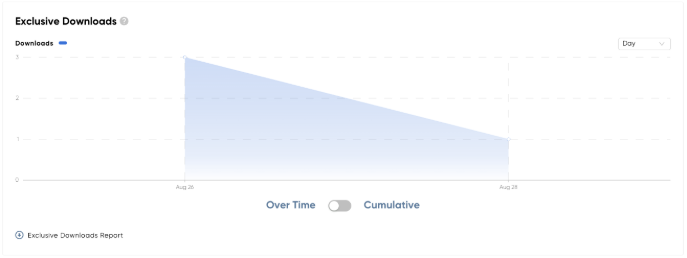
Similar to the Downloads graph, you’re able to change the Date Range filter to either Day or Week. You can also toggle the graph to show downloads Over Time or Cumulative.
Like every other widget on the Downloads page, you’re able to download this one if you’d like.
Quick Access To Other Analytics Dashboards
This widget just provides you with easy-access links to the major listening platforms’ analytic dashboards. See Core Plan Access for more information.
Pro & Enterprise Plan Access
The Pro Plan and Enterprise plans both grant the highest level of access to the Downloads page, unlocking the rest of the features.
Those on the Pro & Enterprise plan are able to view the following widgets:
- Downloads Overview
- Downloads Graph
- Episode Performance Graph & Table
- Listening App/Device/OS Graphs
- Podcast Performance Graph & Table
- Download Time of Day Graph
- Geolocation Performance Table & Graph
- Exclusive Downloads Graph
- Quick Access To Other Analytics Dashboards
Let’s take a closer look at each of these widgets!
Downloads Overview
The Downloads Overview widget gives you a quick view of the most important data for your show(s). This particular widget does not change based on plan. See Core Plan Access for information.
Downloads Graph
Not to be confused with the Downloads Overview section, the Downloads graph displays the number of downloads accumulated over the selected time frame. Similar to the above, this widget remains almost entirely the same no matter which plan you have. See Core Plan Access for information.
The only change to be aware of is the ability to download the report/graph. All members on any paid plan can download reports. If you have multiple shows, then the Podcast Filter defaults to “All Podcasts” rather than a single show like in the Growth plan:
Episode Performance Graph & Table
The Episode Performance Chart and Table further break down the downloads and show what each individual podcast episode received. The chart includes a couple of filters that can change the data displayed in both the chart and the accompanying table.
The Date Range filter allows you to select between the specified Date Range, set by the Time and Date Range filter at the very top of the Downloads page, and the date the episode was first published. See Core Plan Access for information on this graph and table. And see Growth Plan Access for information specifically on the Since Published filter.
A small difference between the Growth plan and the Pro/Enterprise plans is the ability to view data for all podcasts on your account. So, the Episode Performance table may list all episodes for all podcasts depending on the Podcast Filter at the very top:
Listening App/Device/OS Graphs
This set of graphs display where your downloads are coming from. The Listening App graph shows which apps your listeners are using to tune in to your show(s).
The only difference between the Core plan and paid plans, in regards to these widgets, is the ability to download a report for each data set.
Podcast Performance Graph & Table
This combo shows you the performance of all podcasts on your account:
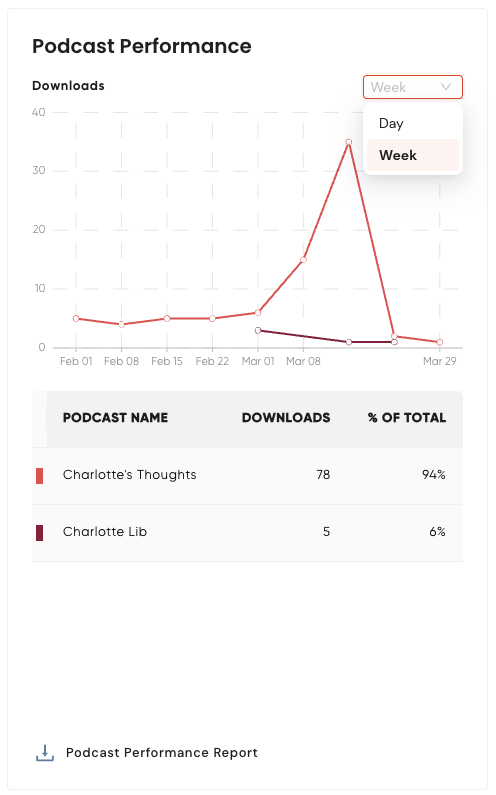
Like similar graphs, you’re able to change the view from daily to weekly by selecting between the two with the drop-down filter in the top-right. If you extend the date range for the entire Downloads page, you can select from 'Mont', 'Quarter', and 'Year' as well.
This graph gives you a quick view of your podcasts and how they are performing compared to one another. If you have more than 5 podcasts, then only the Top 5 (those with the highest number of downloads for that selected date range) will be visible on the graph with color-coded lines. Podcasts not in the Top 5 will still be listed in the accompanying table.
Download Time Of Day Graph
This graph is a heatmap showing you the time of day your listeners tend to tune in to your show. See Growth Plan Access for more information on this widget.
Geolocation Performance Graph & Table
This graph and table combo provides information on where your listeners are tuning in from. See Growth Plan Access for more information on this widget.
Exclusive Downloads Graph
This graph displays the number of downloads for your episodes marked as exclusive. It’s a great way to see how well those specific types of episodes are performing.
See Growth Plan Access for more information on this widget.
Quick Access To Other Analytics Dashboards
This widget just provides you with easy-access links to the major listening platforms’ analytic dashboards. See Core Plan Access for more information.
Have questions? See these resources for more: