Exploring the Dynamic Insertions Page
Last updated: May 29, 2026
Everything You Need to Know About Your Dynamic Insertions
RedCircle provides some of the most powerful analytic tools in podcasting. The analytics page is split into 3 different sections: Downloads, Earnings, and Dynamic Insertions. Depending on your plan, you can view some or all of the available data sets.
Let’s take a deeper look at what the Dynamic Insertions page has to offer!
Core & Growth Plan Access
The Core and Growth Plan don’t currently offer any access to the Dynamic Insertions Analytics page:
Pro & Enterprise Plan Access
The Dynamic Insertions Analytics page is almost fully unlocked at the Pro Plan level. The only difference between the Pro Plan and Enterprise Plan is the ability to view the Other Dynamic Insertions tab in the Dynamic Insertions chart and table combination.
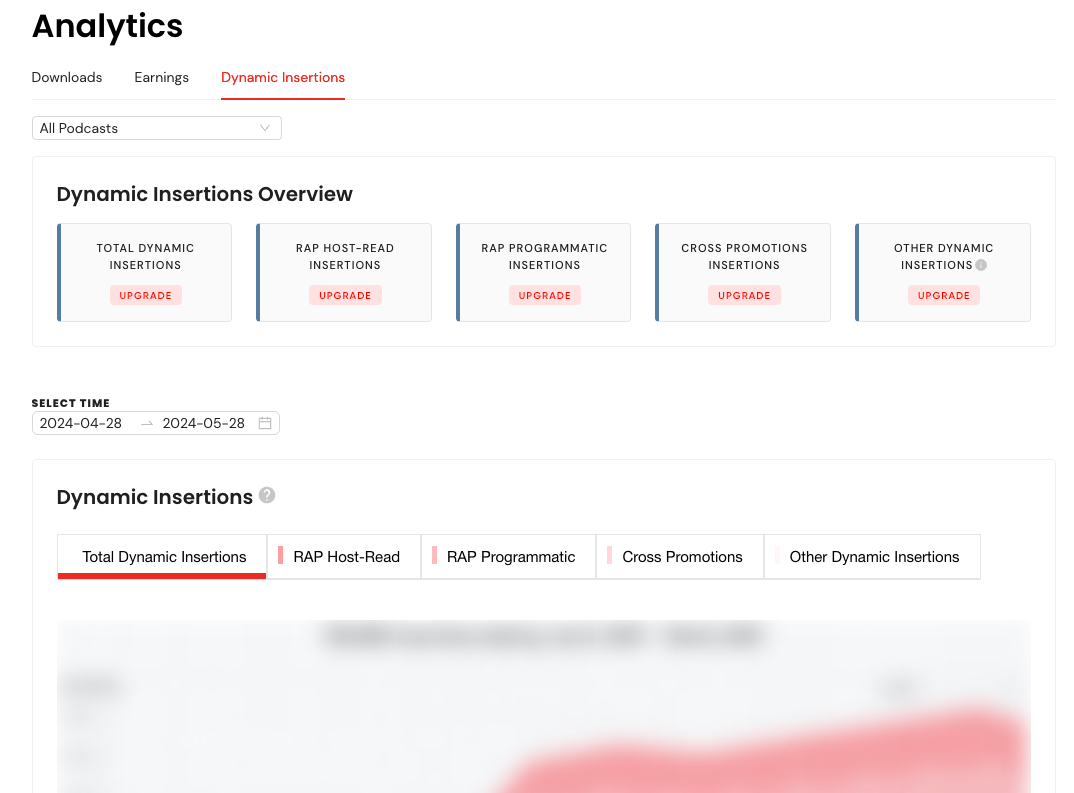
The page is broken down into a few different sections, including:
- Dynamic Insertions Overview: This widget displays quick stats on all the different types of Dynamic Insertions such as RAP Host-Read, RAP Programmatic, Cross-Promotions, and ‘Other’ (which includes Custom Audio)
- Dynamic Insertions: This graph and table combination shows the total number, and type, of insertions that populated in your podcast over a specific period of time.
- Top Episodes: This graph and table combination shows the Top 5 episodes with the highest number of insertions.
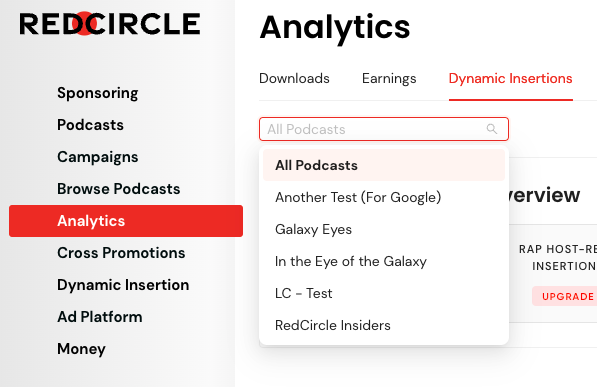
Each of these sections (sans the Overview) display information based on two default filters. The first filter is the Show Filter, which defaults to “All Podcasts” if you have multiple shows. If you have one show, then it defaults to that show!
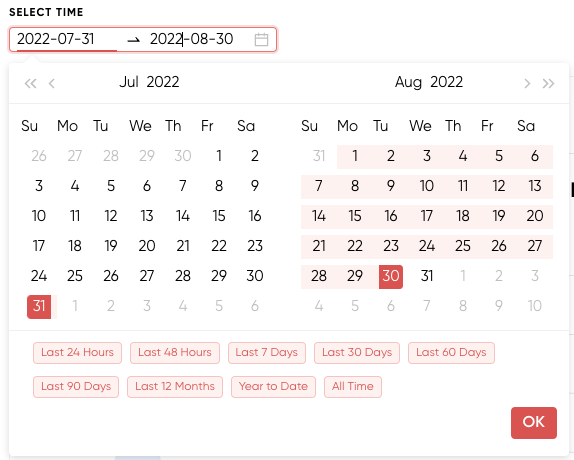
The second filter is the Time and Date Range Filter, which displays data based on the selected time/date range. This filter defaults to the past 30 days, but you’re able to select from a wide variety of preset date ranges or select specific dates.
Let’s jump into what each section entails!
Dynamic Insertions Overview
The Dynamic Insertions Overview widget gives you a quick view of the total number of insertions for each type of insertion:
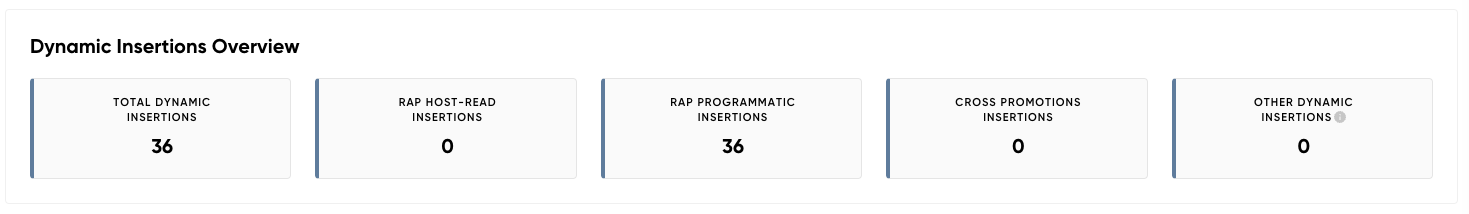
- The Total Dynamic Insertions refers to the total number of all insertion types that populated in your podcast.
- The RAP Host-Read Insertions is the total number of Host-Read Ad campaigns that were inserted into your podcast.
- The RAP Programmatic Insertions is the total number of Programmatic Ads that were inserted into your podcast.
- The Cross Promotions Insertions is the total number of Cross-Promotion campaigns that were inserted into your podcast.
- The Other Dynamic Insertions is the total number of “other” (those not listed) insertions that populated in your podcast.
The Dynamic Insertions Overview widget only changes based on the Show Filter.
Dynamic Insertions Graph & Table
Not to be confused with the Dynamic Insertions Overview section, the Dynamic Insertions chart and table show the number, and type, of insertions over the selected time frame.
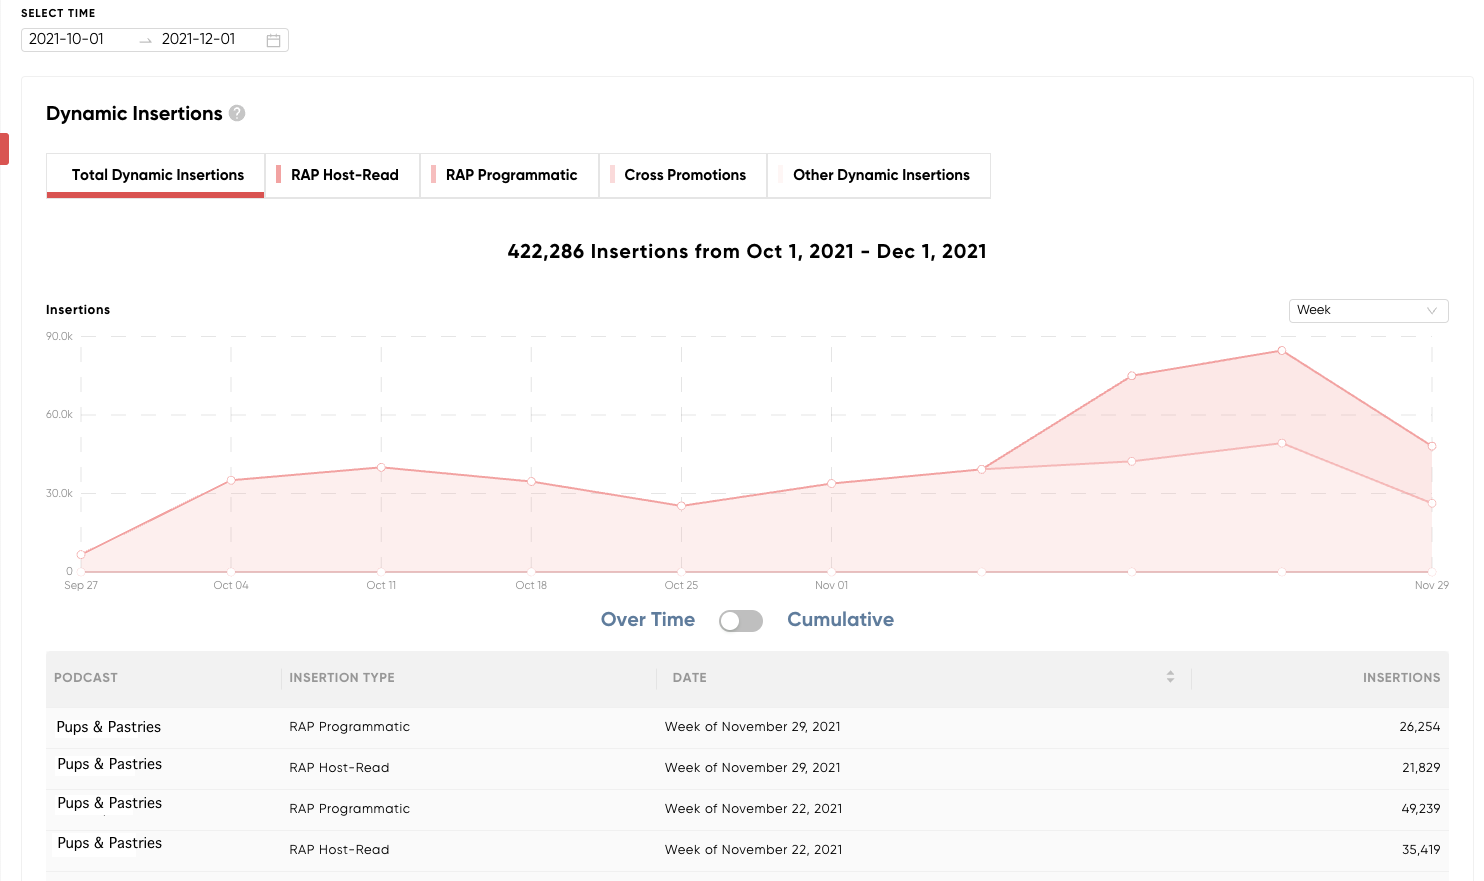
There are a few additional filters for the Dynamic Insertions chart and table including Insertion Tabs, Date Range and Over Time vs. Cumulative.
The Insertions Tabs allow you to isolate specific insertion types such as RAP Host-Read and Cross-Promotions and only show data for that specific insertion type.
Only members on the Enterprise Plan are able to view the Other Dynamic Insertions tab.
The Date Range filter allows you to display data either by “Day” or by “Week”:
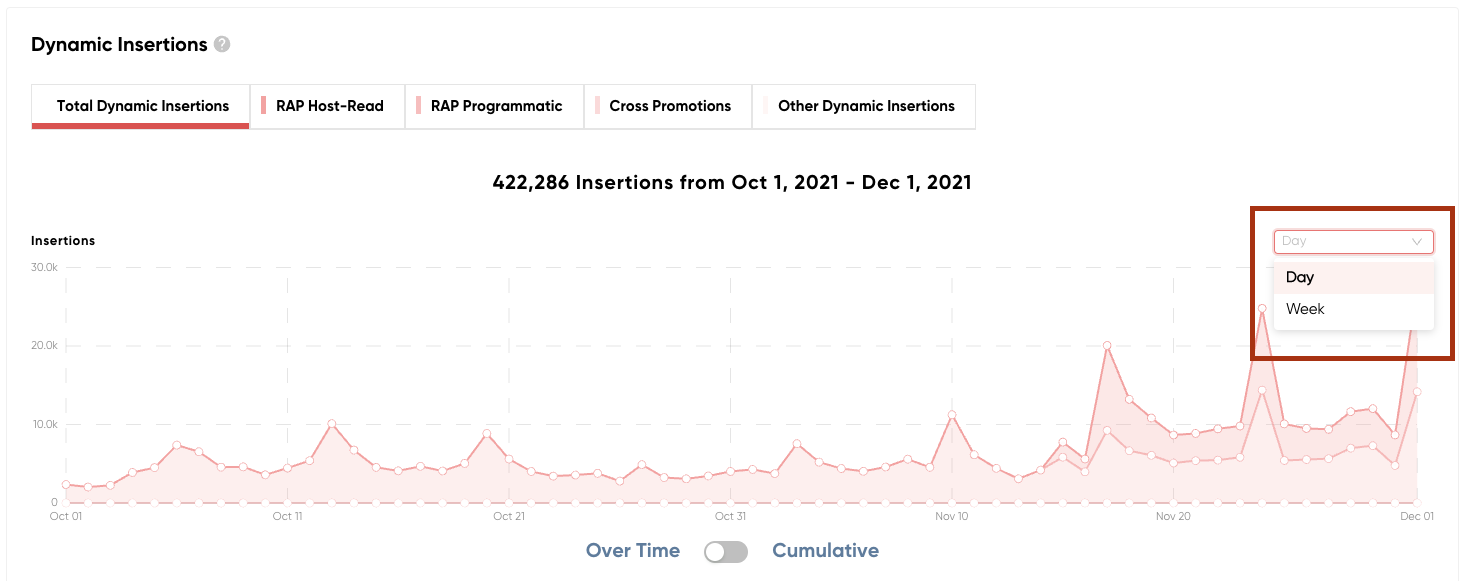
You can see that selecting Day changes the graph. The insertions are being displayed on a weekly interval rather than a daily one.
The Over Time vs. Cumulative toggle shows insertions either “over time”, meaning the number of insertions is shown for each date specified in the Time and Date Range Filter, or “cumulatively”, meaning the number of insertions displayed build on each other.
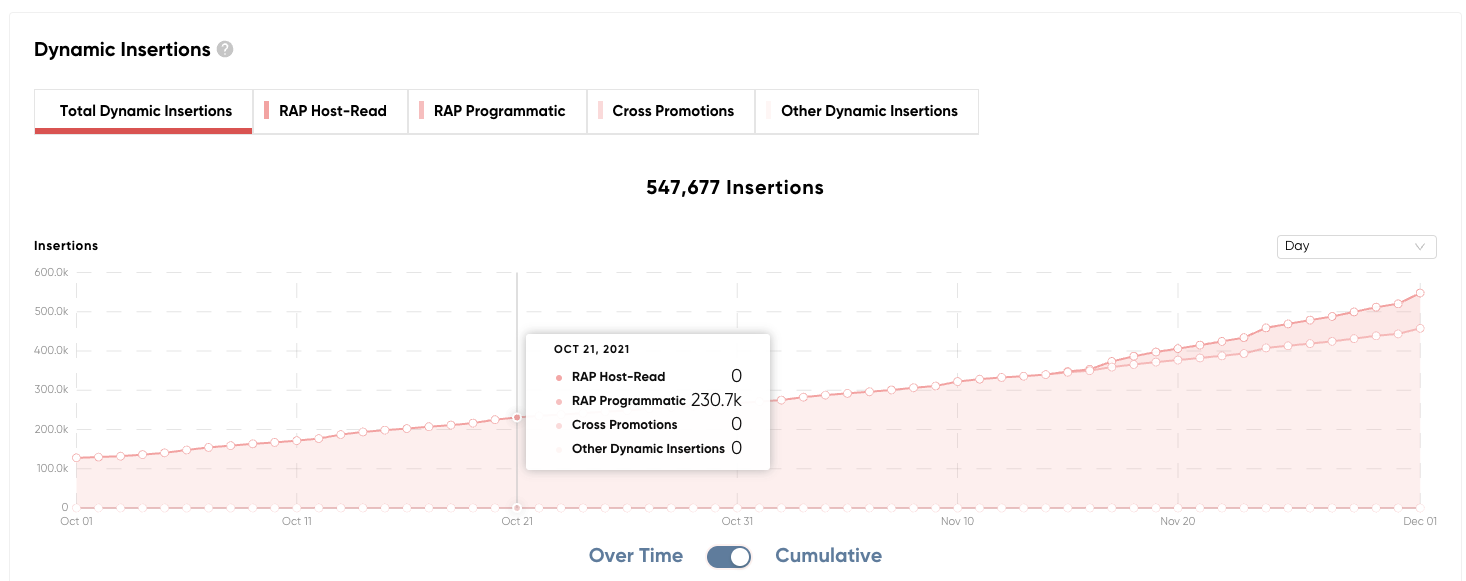
You can see from the above graph that Cumulative creates a slope. This is because it’s showing the total number of insertions played across the specified date range for each date in time. So, by Oct 21st, this podcast totaled 230.7k Programmatic Ad insertions since first opting in to RAP. By Nov 21st, it totaled 382.2k Programmatic Ad insertions since first opting in to RAP.
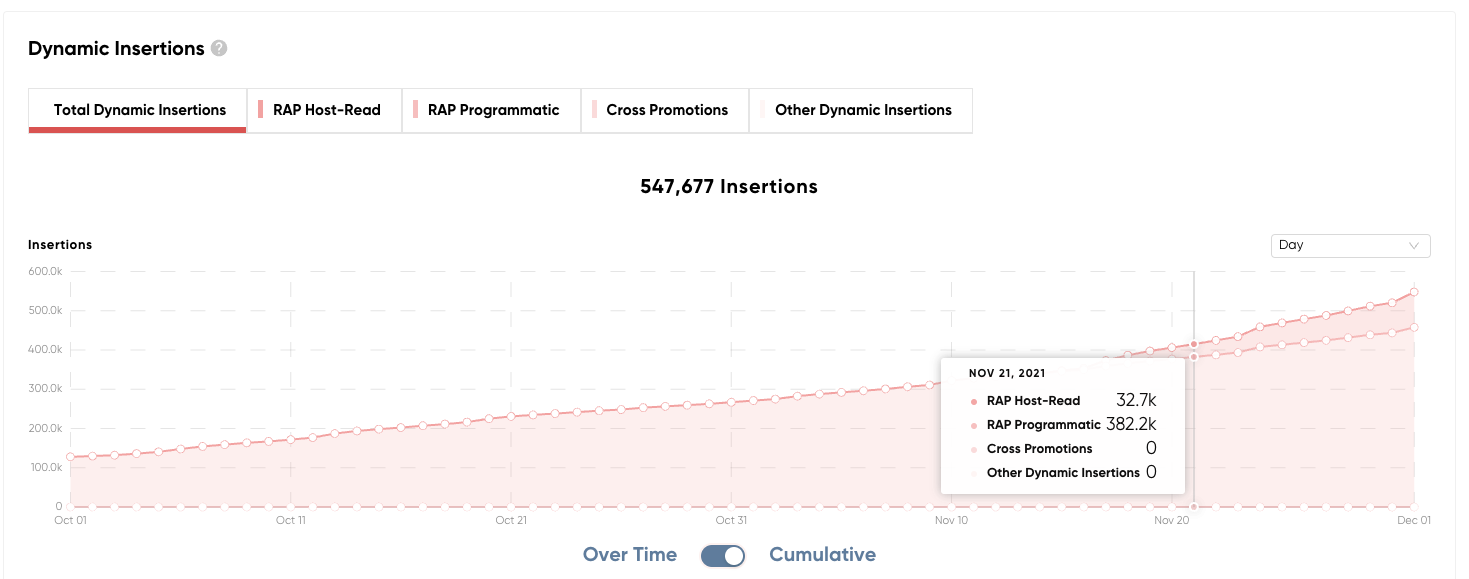
As you can see above, the insertions for Programmatic Ads are building upon one another.
The table below the graph also changes based on the above-mentioned filters. You’re also able to download the table for your own records.
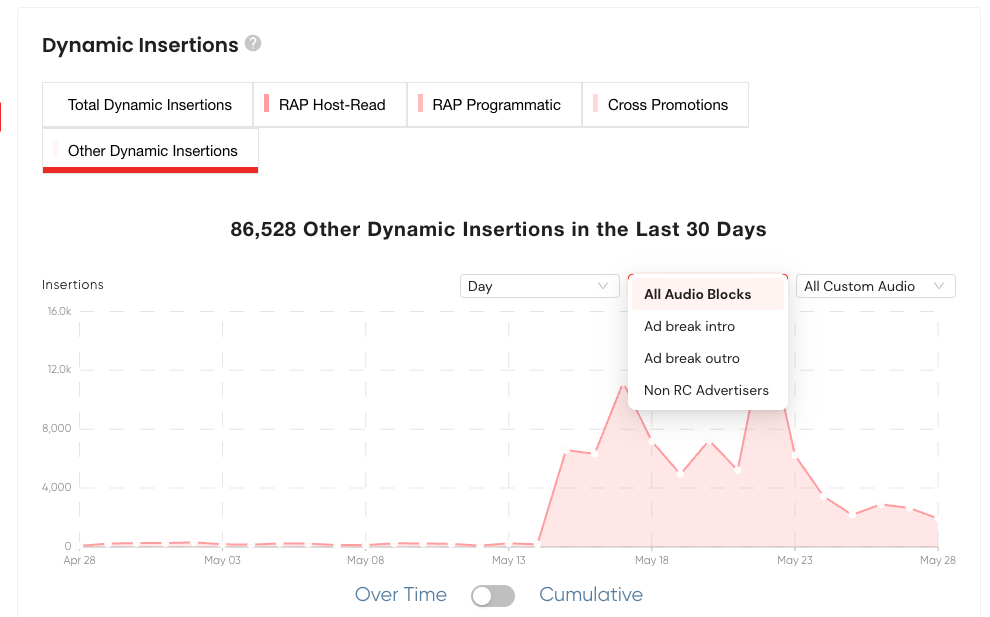
Other Dynamic Insertions Tab
Members on the Enterprise Plan are able to view the “Other Dynamic Insertions” tab which allows you to see stats specifically for custom Audio Blocks and Audio Clips.
You can view all custom Audio Blocks and Audio Clips, or specific ones based on the drop-down:
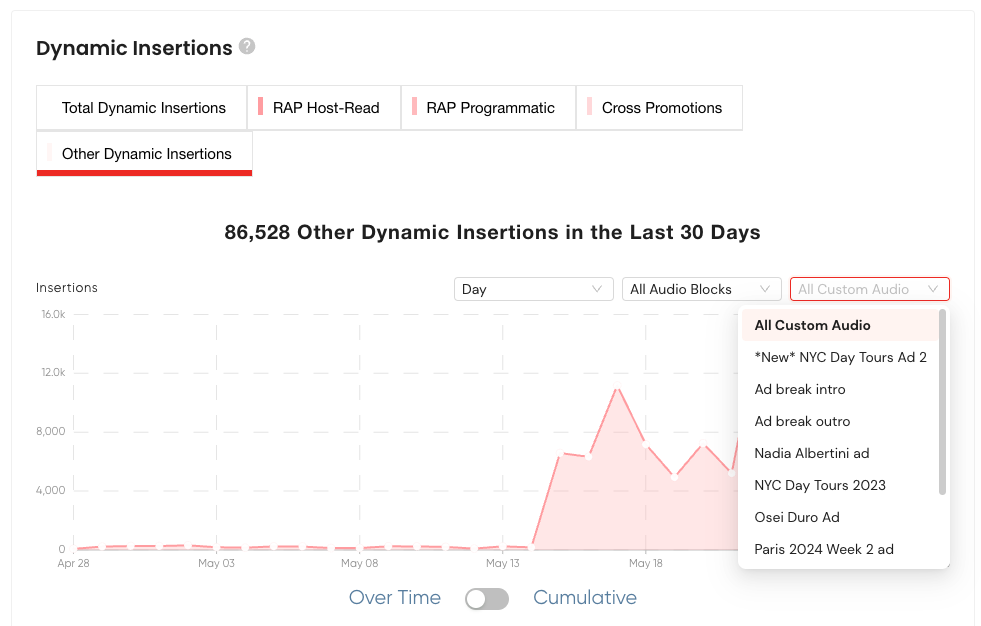
You can also change the time range from “Day” to “Week” to view different charts.
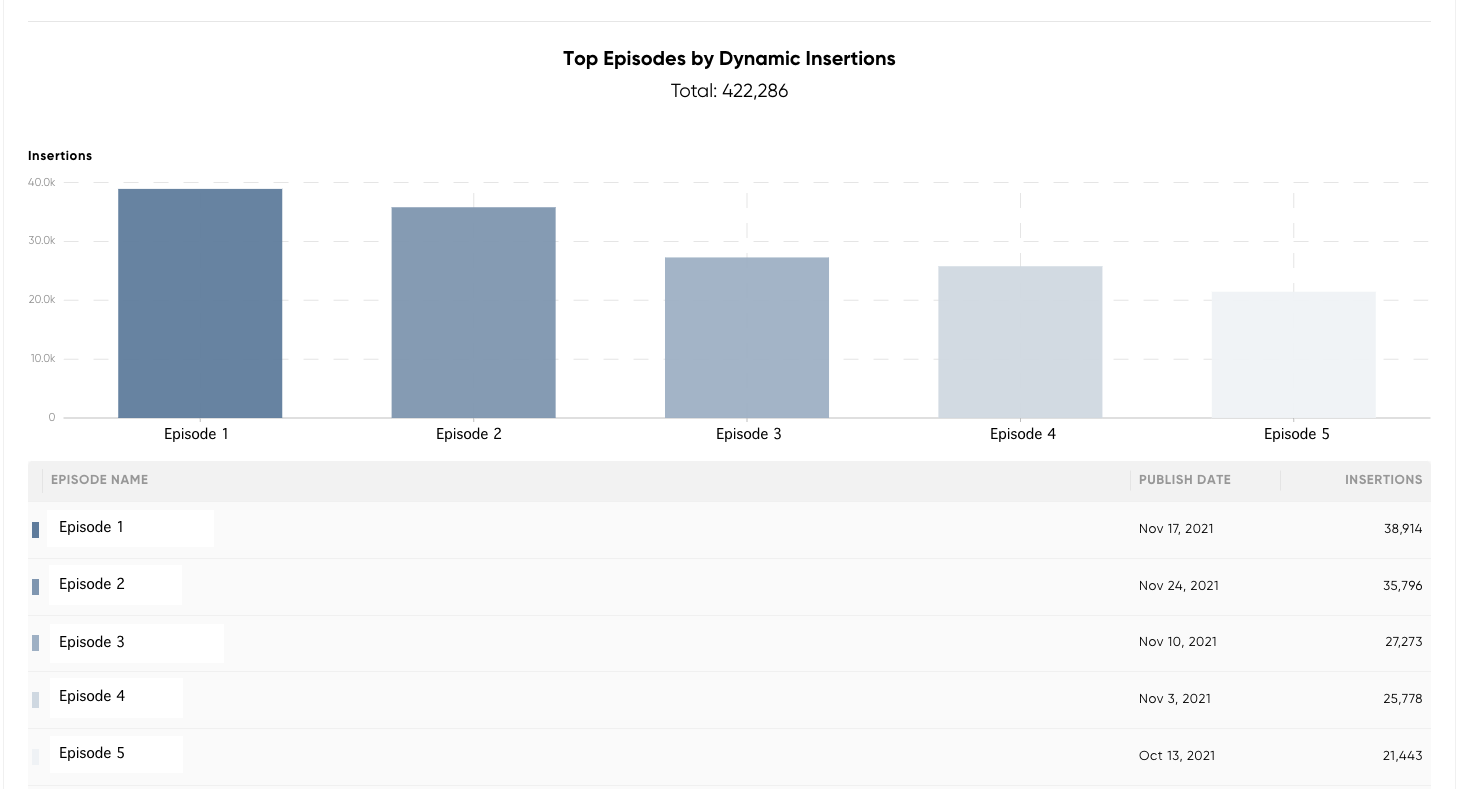
Top Episodes Graph & Table
This chart and table show you which episodes have the highest number of insertions. The chart only displays the top 5 episodes while the table includes all episodes from highest to lowest number of insertions. The top 5 episodes have coordinating colors for both the chart and the table.
Unlike the above section, this graph and table combination doesn’t come with additional filters. The graph and table are only affected by the Show Filter and the Time and Date Range Filter.
You’re also able to download the table for your own records.
Have questions? See these resources for more: