Exploring the Earnings Page
Last updated: May 29, 2026
Everything You Need to Know About Your Earnings
RedCircle provides some of the most powerful analytic tools in podcasting. The analytics page is split into 3 different sections: Downloads, Earnings, and Dynamic Insertions. Depending on your plan, you can view some or all of the available data sets.
Let’s take a deeper look at what the Earnings page has to offer!
Earnings Page Overview
This page comes to life only when you start to collect payment. Either through opting in to RAP, enabling Exclusive Content, or turning on Donations. The data displayed depends entirely on the monetization options you have enabled and your current plan with RedCircle.
The page features only two sections:
- Earnings Overview: Displays quick stats on all monetization avenues.
- Earnings: A graph and table combo that displays all earnings for your show(s). This graph and table combo features tabs so you can isolate specific revenue channels.
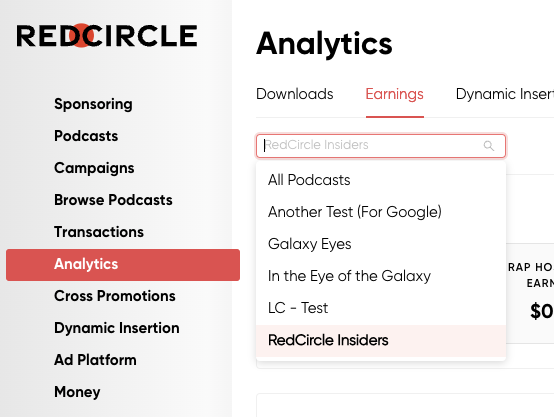
Both of these sections display information based on one filter. The only filter is the Show Filter, which defaults to “All Podcasts” if you have multiple shows. If you have one show, then it defaults to that show!
Now that we covered the basics of the Earnings page, let’s take a look at the differences for each plan.
Core & Growth Plan Access
Both the Core (Free) plan and the Growth plan provide a limited view of the Earnings page. Those on either of these plans are only able to view the Earnings Overview.
Let’s take a closer look at the Earnings Overview widget!
Earnings Overview
The Earnings Overview widget gives you a quick view of the most important revenue data for your show(s).
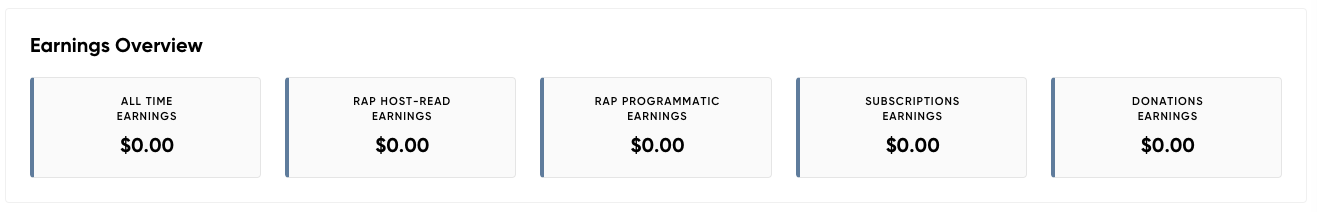
This widget gives you a bird’s eye view of your total revenue earnings. Depending on your enabled monetization features, you may see a red and white “opt in” button instead of a monetary total:
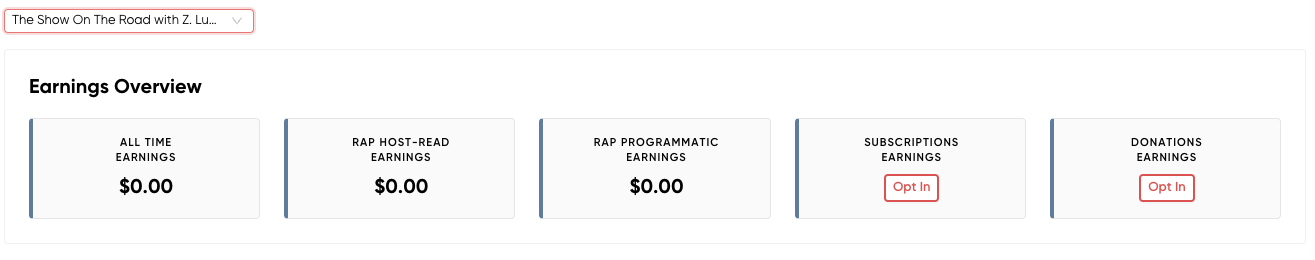
The totals in the Earnings Overview section will always be for all time. So, the monetary value shown is an accumulation of your earnings since day 1 of enabling each monetization feature.
Pro & Enterprise Plan Access
Those on either the Pro or Enterprise plan are able to view both the Earnings Overview and the Earnings Graph/Table.
See the above section for information on the Earnings Overview widget.
Earnings Graph & Table
The Earnings Graph and Table provide a much more detailed look at your various revenue streams.
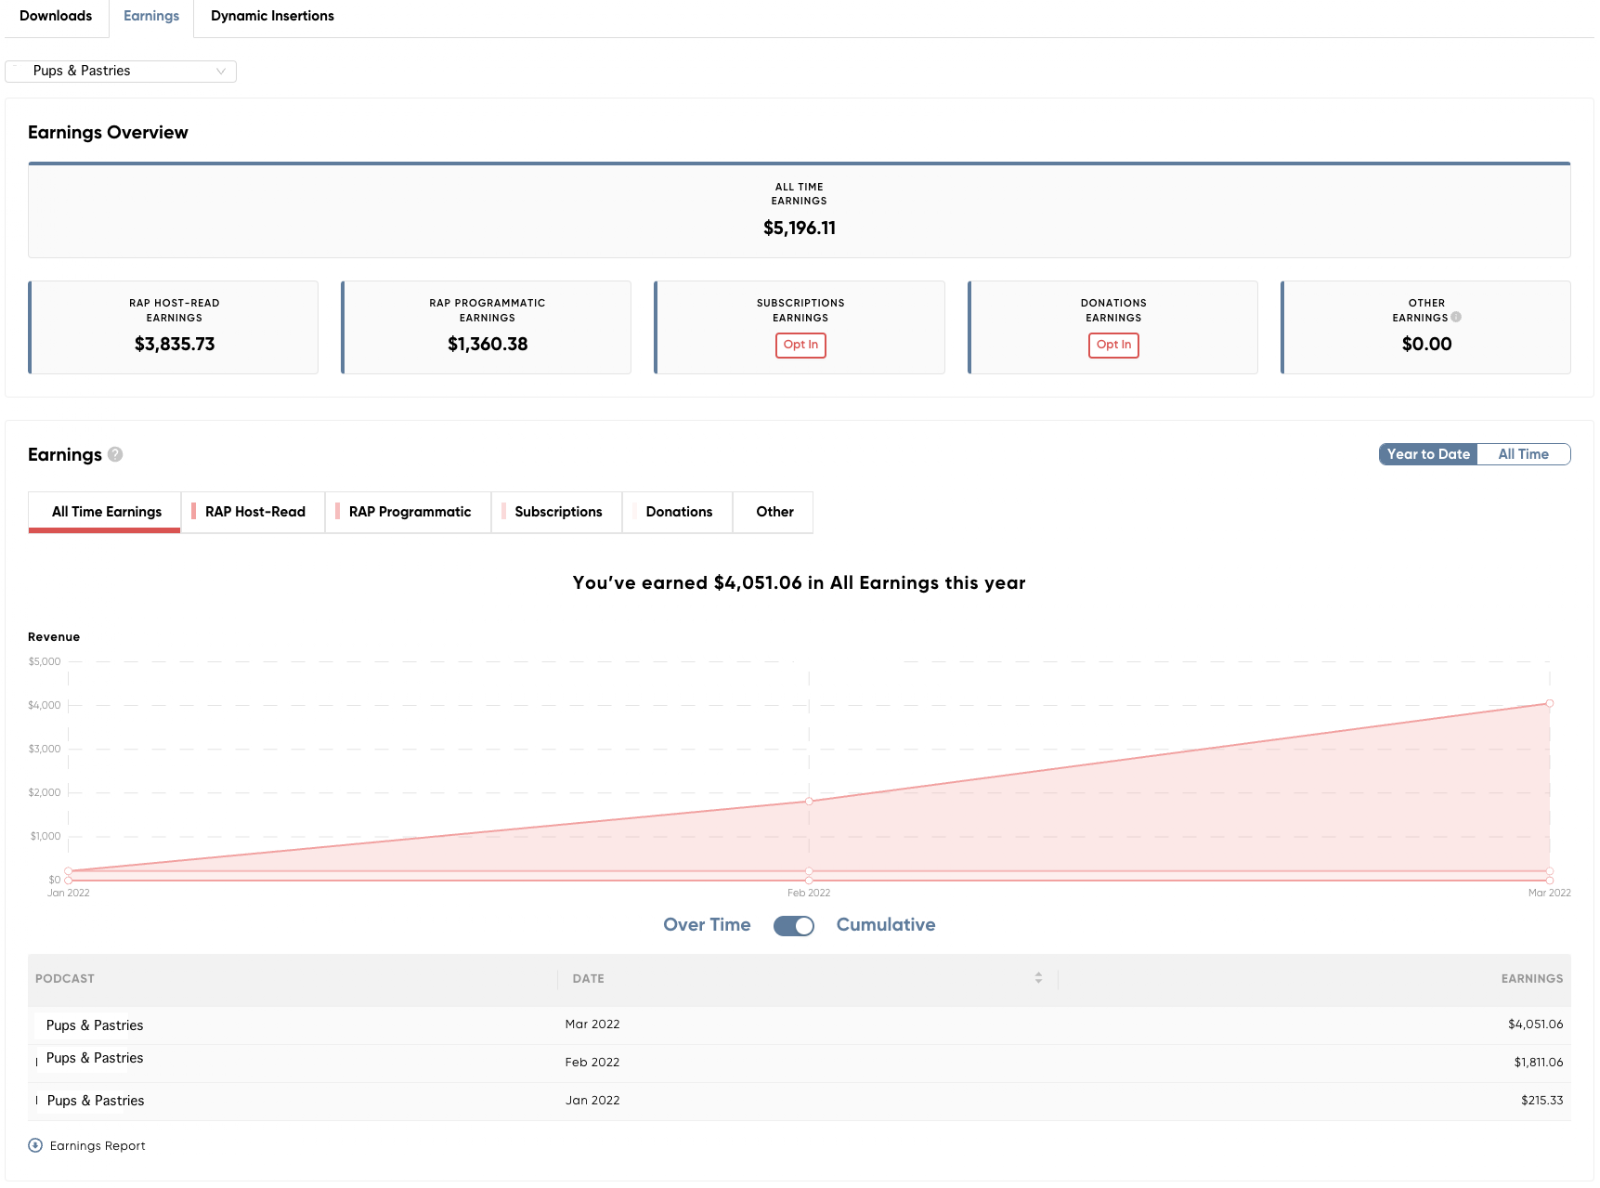
You can change the view of the graph and table to show All Earnings, only RAP Host-Read Earnings, only RAP Programmatic Earnings, only Subscriptions (Exclusive Content), only Donations, or only ‘Other’ earnings (which refers to any other types of payment outside of those already listed.)
Both the table and the graph change based on the tab you select.
You can also switch the time and date toggle from “Over Time” to “Cumulative” to change how the earnings are calculated and shown. “Over Time” refers to revenue earned for each individual month. While “Cumulative” refers to revenue earned in total, each month building upon one another.
In addition to the time and date toggle, you can switch between “Year to Date” and “All Time” to view revenue earned from the beginning of the year to present, or from the first day you started earning revenue.
Finally, members on either the Pro plan or Enterprise plan are able to download and save the report to their device.
Have questions? See these resources for more: